Page 199 - ICSE Math 5
P. 199

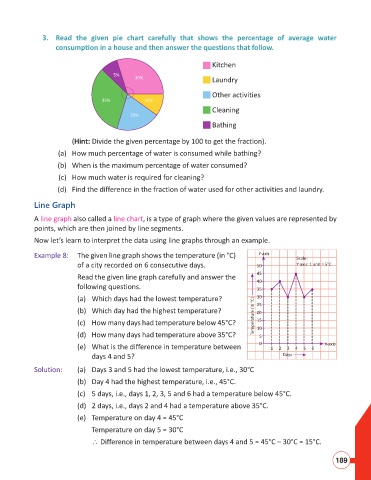
3.  Read the given pie chart carefully that shows the percentage of average water
                           consumption in a house and then answer the questions that follow.

                                                                               Kitchen

                                              5%
                                                     30%                       Laundry

                                                                               Other activities
                                          35%           10%
                                                                               Cleaning
                                                    20%
                                                                               Bathing

                                (Hint: Divide the given percentage by 100 to get the fraction).

                            (a)  How much percentage of water is consumed while bathing?
                           (b)  When is the maximum percentage of water consumed?

                            (c)  How much water is required for cleaning?
                           (d)  Find the difference in the fraction of water used for other activities and laundry.

                    Line Graph

                    A line graph also called a line chart, is a type of graph where the given values are represented by
                    points, which are then joined by line segments.

                    Now let’s learn to interpret the data using line graphs through an example.

                    Example 8:  The given line graph shows the temperature (in °C)            Y-axis       Scale:
                                  of a city recorded on 6 consecutive days.                   50           Y-axis: 1 unit = 5°C
                                                                                              45
                                  Read the given line graph carefully and answer the
                                                                                              40
                                  following questions.                                        35
                                  (a)  Which days had the lowest temperature?                 30
                                                                                              25
                                  (b)  Which day had the highest temperature?                Temperature (in °C)  20

                                  (c)   How many days had temperature below 45°C?             15
                                                                                              10
                                  (d)   How many days had temperature above 35°C?              5

                                  (e)   What is the difference in temperature between          0  1  2  3  4  5  6  X-axis
                                       days 4 and 5?                                                  Days

                    Solution:     (a)  Days 3 and 5 had the lowest temperature, i.e., 30°C
                                  (b)  Day 4 had the highest temperature, i.e., 45°C.

                                  (c)  5 days, i.e., days 1, 2, 3, 5 and 6 had a temperature below 45°C.
                                  (d)  2 days, i.e., days 2 and 4 had a temperature above 35°C.

                                  (e)  Temperature on day 4 = 45°C
                                       Temperature on day 5 = 30°C

                                        Difference in temperature between days 4 and 5 = 45°C – 30°C = 15°C.

                                                                                                                        189
   194   195   196   197   198   199   200   201   202   203   204