Page 201 - ICSE Math 5
P. 201

2.  Draw a bar graphs for the given data. Then answer the following questions.

                            Subject                      English     Hindi   Mathematics      Science    Social Studies
                            Marks Scored by Navya          50         60           70            65           55

                            (a)  In which subject did Navya score the highest marks and by how much?
                           (b)  What is the lowest score she obtained? In which subject did she get it?

                            (c)  How many marks did Navya score in Science?
                           (d)  If these marks are out of 80, what is her percentage in Hindi and Social Studies?

                      3.  Represent the given information using tally marks.

                            (a)   Fruits in a Basket     Apple      Banana        Litchi      Guava

                                  Number of Fruits         10           5          12           3
                           (b)
                                 Item                      Crayon    Notebook      Pencil       Pen       Eraser

                                 Number of Item Sold         25          20          15           5         10

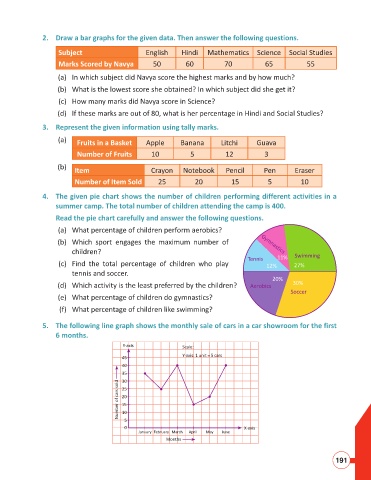
                      4.  The given pie chart shows the number of children performing different activities in a
                           summer camp. The total number of children attending the camp is 400.
                          Read the pie chart carefully and answer the following questions.

                            (a)  What percentage of children perform aerobics?
                           (b)  Which sport engages the maximum number of                      Gymnastics
                                children?
                                                                                           Tennis    11%  Swimming
                            (c)  Find the total percentage of children who play                  12%      27%
                                tennis and soccer.
                                                                                                   20%
                           (d)  Which activity is the least preferred by the children?      Aerobics      30%
                                                                                                         Soccer
                            (e)  What percentage of children do gymnastics?
                            (f)  What percentage of children like swimming?


                      5.  The following line graph shows the monthly sale of cars in a car showroom for the first
                           6 months.
                                                 Y-axis              Scale:
                                                                     Y-axis: 1 unit = 5 cars
                                                 45
                                                 40
                                                 35
                                                 30
                                                Number of cars sold  25
                                                 20
                                                 15
                                                 10
                                                  5
                                                  0                                       X-axis
                                                      January February March  April  May  June
                                                                Months


                                                                                                                        191
   196   197   198   199   200   201   202   203   204   205   206