Page 196 - ICSE Math 5
P. 196

Exercise 14.2


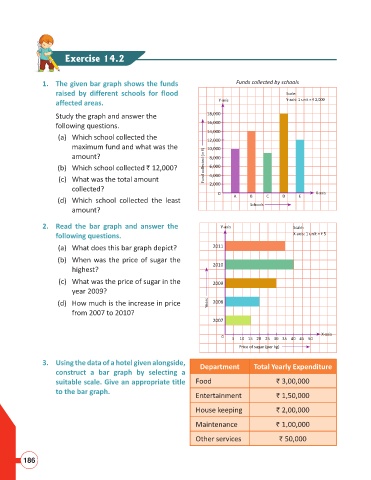
                      1.  The given bar graph shows the funds                          Funds collected by schools
                           raised by different schools for flood                                        Scale:
                           affected areas.                                       Y-axis                 Y-axis: 1 unit = ` 2,000

                          Study the graph and answer the                     18,000
                           following questions.                              16,000
                                                                             14,000
                            (a)  Which school collected the
                                                                             12,000
                                maximum fund and what was the                10,000
                                amount?                                       8,000

                           (b)  Which school collected ` 12,000?            Fund collected (in `)  6,000
                            (c)  What was the total amount                    4,000
                                                                              2,000
                                collected?
                                                                                 0    A     B    C    D     E    X-axis
                           (d)  Which school collected the least
                                                                                            Schools
                                amount?

                      2.  Read the bar graph and answer the                       Y-axis                  Scale:
                           following questions.                                                           X-axis: 1 unit = ` 5
                            (a)  What does this bar graph depict?              2011

                           (b)  When was the price of sugar the
                                                                               2010
                                highest?
                            (c)  What was the price of sugar in the            2009
                                year 2009?

                           (d)  How much is the increase in price             Years  2008
                                from 2007 to 2010?
                                                                               2007

                                                                                                                   X-axis
                                                                                  0
                                                                                      5  10 15 20 25 30 35 40 45 50
                                                                                        Price of sugar (per kg)
                      3.  Using the data of a hotel given alongside,       Department        Total Yearly Expenditure
                           construct a bar graph by selecting a
                           suitable scale. Give an appropriate title     Food                       ` 3,00,000
                           to the bar graph.
                                                                         Entertainment              ` 1,50,000

                                                                         House keeping              ` 2,00,000

                                                                         Maintenance                ` 1,00,000

                                                                         Other services              ` 50,000


                186
   191   192   193   194   195   196   197   198   199   200   201