Page 195 - ICSE Math 5
P. 195

Read the bar graph carefully and answer the following questions.
                                  (a)   What is the scale chosen on the horizontal line representing the sale of number
                                       of trousers?
                                  (b)   On which day were the maximum number of trousers sold? How many trousers
                                       were sold on that day?

                                  (c)   On which day were the minimum number of trousers sold? What is their
                                       number?
                                  (d)  How many trousers were sold on Monday?

                    Solution:     (a)  Scale on the horizontal line, X-axis: 1 unit = sale of 5 trousers.
                                  (b)  The maximum number of trousers were sold on Saturday, i.e., 65 trousers.
                                  (c)  The minimum number of trousers were sold on Wednesday, i.e., 20 trousers.

                                  (d)  40 trousers were sold on Monday.
                    Example 5:  The table given below shows the number of children who like to play different
                                  sports in a locality.

                                   Sport                    Badminton      Hockey      Cricket      Chess      Football
                                   Number of Children           45           30          35          10          20

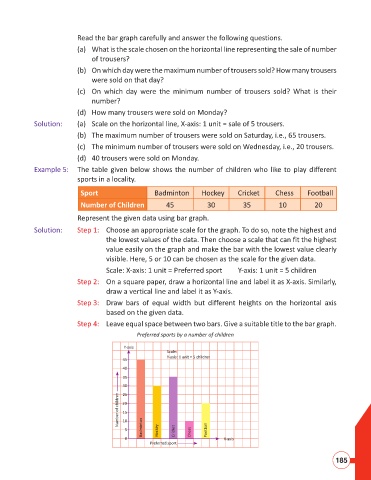
                                  Represent the given data using bar graph.

                    Solution:     Step 1:   Choose an appropriate scale for the graph. To do so, note the highest and
                                            the lowest values of the data. Then choose a scale that can fit the highest
                                            value easily on the graph and make the bar with the lowest value clearly
                                            visible. Here, 5 or 10 can be chosen as the scale for the given data.
                                            Scale: X-axis: 1 unit = Preferred sport  Y-axis: 1 unit = 5 children
                                  Step 2:  On a square paper, draw a horizontal line and label it as X-axis. Similarly,
                                            draw a vertical line and label it as Y-axis.

                                  Step 3:  Draw bars of equal width but different heights on the horizontal axis
                                            based on the given data.
                                  Step 4:  Leave equal space between two bars. Give a suitable title to the bar graph.

                                                      Preferred sports by a number of children
                                                  Y-axis
                                                                Scale:
                                                                Y-axis: 1 unit = 5 children
                                                 45
                                                 40
                                                 35
                                                 30
                                                 25
                                                Number of children  20

                                                 15
                                                 10
                                                  5     Badminton  Hockey  Cricket  Chess  Football
                                                  0                                X-axis
                                                          Preferred sport

                                                                                                                        185
   190   191   192   193   194   195   196   197   198   199   200