
Page 191 - ICSE Math 5
P. 191
Da
14 Data Handlingta Handling
Learning Outcomes
Students will be able to learn:
to represent raw data in tabular form.
the pictorial representation of raw data.
to interpret bar graphs, pie charts and line graphs.
We have learnt that data is the collection of information and can be represented in the form
of pictographs, tally marks and bar graphs. This representation of data gives us a clear idea to
interpret the given information in an easier way. The representation of data in different forms is
called data handling.
Raw Data and Its Representation in Tabular Form
We know that before representing data in any form, it needs to be collected. This collected data
is not in any particular order and is called raw data. It is usually not easy to study raw data and
draw information from it. Thus, after collecting the data, we arrange it in a tabular form so that
it becomes convenient for us to get information and draw conclusions from it. Let’s consider an
example to understand how to arrange collected data in a tabular form.
Example 1: For a class party, Rashi’s group has to bring fruits for the whole class. She collects
data about the fruits that her classmates like as shown below.
apple, banana, cherries, apple, guava, banana, orange, grapes, cherries, guava,
banana, apple, grapes, cherries, orange, guava, banana, cherries, grapes, grapes,
apple, orange, cherries, grapes, banana, orange, guava, cherries, grapes, orange,
apple, banana, grapes, cherries, grapes
Arrange the given data in a tabular form and answer the following questions.
(a) Which two fruits are liked by the same number of Rashi’s classmates?
(b) How many of her classmates like cherries?
(c) How many more classmates of Rashi like grapes than bananas?
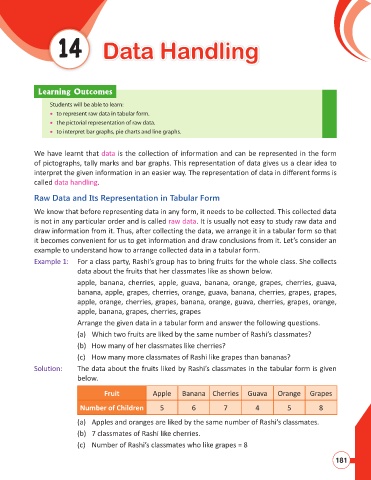
Solution: The data about the fruits liked by Rashi’s classmates in the tabular form is given
below.
Fruit Apple Banana Cherries Guava Orange Grapes
Number of Children 5 6 7 4 5 8
(a) Apples and oranges are liked by the same number of Rashi’s classmates.
(b) 7 classmates of Rashi like cherries.
(c) Number of Rashi’s classmates who like grapes = 8
181