
Page 192 - ICSE Math 5
P. 192
Number of Rashi’s classmates who like bananas = 6
Difference = 8 – 6 = 2
So, there are 2 more classmates of Rashi who like grapes than bananas.
Pictograph
When data is represented by pictures, it is called pictograph. Let’s learn the rules we follow to
represent a pictograph.
• A pictograph must have a title.
• The symbol used in the pictograph must be defined.
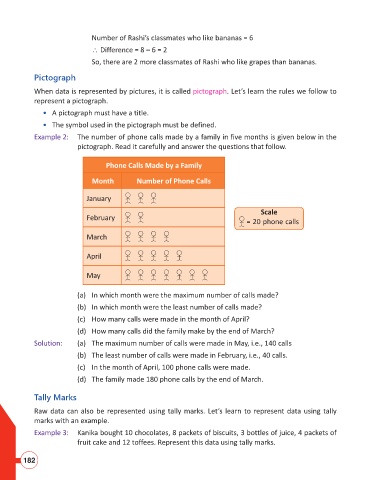
Example 2: The number of phone calls made by a family in five months is given below in the
pictograph. Read it carefully and answer the questions that follow.
Phone Calls Made by a Family
Month Number of Phone Calls
January
Scale
February = 20 phone calls
March
April
May
(a) In which month were the maximum number of calls made?
(b) In which month were the least number of calls made?
(c) How many calls were made in the month of April?
(d) How many calls did the family make by the end of March?
Solution: (a) The maximum number of calls were made in May, i.e., 140 calls
(b) The least number of calls were made in February, i.e., 40 calls.
(c) In the month of April, 100 phone calls were made.
(d) The family made 180 phone calls by the end of March.
Tally Marks
Raw data can also be represented using tally marks. Let’s learn to represent data using tally
marks with an example.
Example 3: Kanika bought 10 chocolates, 8 packets of biscuits, 3 bottles of juice, 4 packets of
fruit cake and 12 toffees. Represent this data using tally marks.
182