Page 194 - ICSE Math 5
P. 194

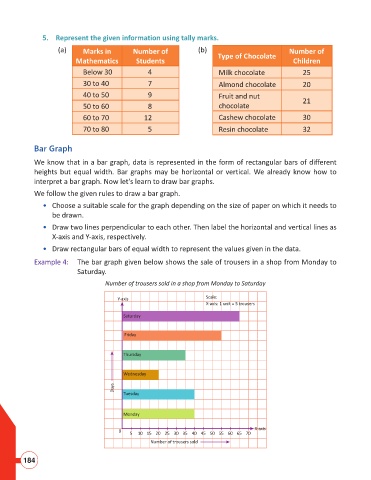
5.  Represent the given information using tally marks.
                            (a)     Marks in         Number of            (b)                            Number of
                                                                                 Type of Chocolate
                                  Mathematics         Students                                            Children

                                    Below 30              4                      Milk chocolate              25
                                    30 to 40              7                      Almond chocolate            20

                                    40 to 50              9                      Fruit and nut
                                    50 to 60              8                      chocolate                   21
                                    60 to 70            12                       Cashew chocolate            30

                                    70 to 80              5                      Resin chocolate             32

                    Bar Graph


                    We know that in a bar graph, data is represented in the form of rectangular bars of different
                    heights but equal width. Bar graphs may be horizontal or vertical. We already know how to
                    interpret a bar graph. Now let’s learn to draw bar graphs.
                    We follow the given rules to draw a bar graph.
                     •  Choose a suitable scale for the graph depending on the size of paper on which it needs to
                          be drawn.

                     •  Draw two lines perpendicular to each other. Then label the horizontal and vertical lines as
                          X-axis and Y-axis, respectively.

                     •  Draw rectangular bars of equal width to represent the values given in the data.
                    Example 4:  The bar graph given below shows the sale of trousers in a shop from Monday to
                                  Saturday.

                                           Number of trousers sold in a shop from Monday to Saturday

                                               Y-axis                        Scale:
                                                                             X-axis: 1 unit = 5 trousers

                                                 Saturday


                                                  Friday


                                                 Thursday


                                                 Wednesday
                                              Days
                                                 Tuesday


                                                 Monday

                                                                                             X-axis
                                                0
                                                    5  10 15 20 25 30 35 40 45 50 55 60 65 70
                                                          Number of trousers sold

                184
   189   190   191   192   193   194   195   196   197   198   199