Page 202 - ICSE Math 5
P. 202

Read the line graph carefully and answer the following questions.
                            (a)  Which months had the minimum sale?
                           (b)  Whether the sale increased or decreased from February to March? If yes, then by
                                how much?

                            (c)  How many cars were sold in all the 6 months?
                           (d)  How many more cars were sold in June than in January?


                               Values and Life Skills


                                                                                                            35
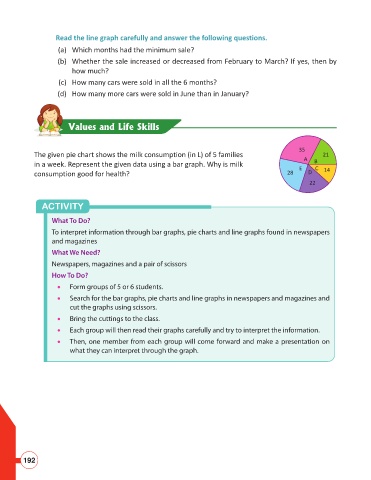
                    The given pie chart shows the milk consumption (in L) of 5 families                             21
                                                                                                             A
                    in a week. Represent the given data using a bar graph. Why is milk                      E    B C
                    consumption good for health?                                                        28     D    14
                                                                                                               22


                      ACTIVITY


                         What To Do?
                         To interpret information through bar graphs, pie charts and line graphs found in newspapers
                         and magazines
                         What We Need?

                         Newspapers, magazines and a pair of scissors
                         How To Do?
                                Form groups of 5 or 6 students.

                                Search for the bar graphs, pie charts and line graphs in newspapers and magazines and
                               cut the graphs using scissors.
                                Bring the cuttings to the class.
                                Each group will then read their graphs carefully and try to interpret the information.
                                Then, one member from each group will come forward and make a presentation on

                               what they can interpret through the graph.


                192
   197   198   199   200   201   202   203   204   205   206   207