
Page 331 - Start Up Mathematics_8 (Non CCE)
P. 331
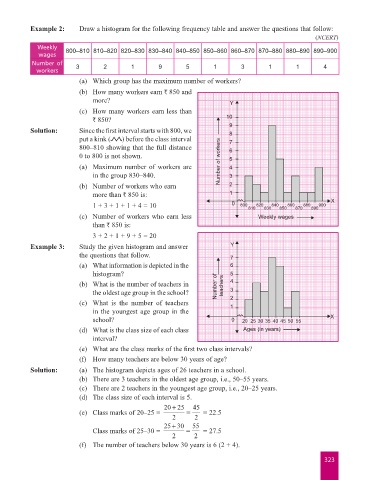
Example 2:      Draw a histogram for the following frequency table and answer the questions that follow:
                                                                                                                 (NCERT)
                      Weekly   800–810 810–820 820–830 830–840 840–850 850–860 860–870 870–880 880–890 890–900
                      wages
                    Number of      3        2        1        9        5        1        3        1        1        4
                      workers
                                    (a)  Which group has the maximum number of workers?
                                    (b)   How many workers earn ` 850 and
                                        more?                                        Y
                                    (c)   How many workers earn less than
                                        ` 850?                                      10
                                                                                     9
                    Solution:       Since the first interval starts with 800, we     8
                                    put a kink (  ) before the class interval        7
                                    800–810 showing that the full distance           6
                                    0 to 800 is not shown.                           5
                                    (a)   Maximum number of workers are           Number of workers  4
                                        in the group 830–840.                        3
                                    (b)   Number of workers who earn                 2
                                        more than ` 850 is:                          1
                                        1 + 3 + 1 + 1 + 4 = 10                       0  800  810  820  830  840  850  860  870  880  890  900  X
                                    (c)   Number of workers who earn less                     Weekly wages
                                        than ` 850 is:
                                        3 + 2 + 1 + 9 + 5 = 20

                    Example 3:      Study the given histogram and answer             Y
                                    the questions that follow.                       7
                                    (a)   What information is depicted in the        6
                                        histogram?                                   5
                                    (b)   What is the number of teachers in     Number of    teachers  4
                                        the oldest age group in the school?          3
                                    (c)   What is the number of teachers             2
                                                                                     1
                                        in the youngest age group in the
                                        school?                                      0   20  25 30 35  40  45 50  55   X
                                    (d)   What is the class size of each class           Ages (in years)
                                        interval?
                                    (e)   What are the class marks of the first two class intervals?
                                    (f)   How many teachers are below 30 years of age?
                    Solution:       (a)  The histogram depicts ages of 26 teachers in a school.
                                    (b)  There are 3 teachers in the oldest age group, i.e., 50–55 years.
                                    (c)  There are 2 teachers in the youngest age group, i.e., 20–25 years.
                                    (d)  The class size of each interval is 5.
                                                               20 25+    45
                                    (e)  Class marks of 20–25 =        =     = 22.5
                                                                  2      2
                                                               25 30+    55
                                        Class marks of 25–30 =         =     = 27.5
                                                                  2      2
                                    (f)  The number of teachers below 30 years is 6 (2 + 4).

                                                                                                                    323