
Page 328 - Start Up Mathematics_8 (Non CCE)
P. 328
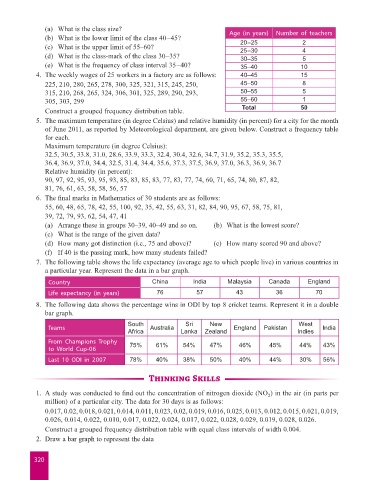
(a)  What is the class size?                                Age (in years)  Number of teachers
                         (b)  What is the lower limit of the class 40–45?
                         (c)  What is the upper limit of 55–60?                         20–25                2
                                                                                                             4
                                                                                        25–30
                         (d)  What is the class-mark of the class 30–35?                30–35                5
                         (e)  What is the frequency of class interval 35–40?            35–40               10
                      4.  The weekly wages of 25 workers in a factory are as follows:   40–45               15
                         225, 210, 280, 265, 278, 300, 325, 321, 315, 245, 250,         45–50                8
                        315, 210, 268, 265, 324, 306, 301, 325, 289, 290, 293,          50–55                5
                        305, 303, 299                                                   55–60                1
                         Construct a grouped frequency distribution table.               Total              50
                      5.  The maximum temperature (in degree Celsius) and relative humidity (in percent) for a city for the month
                        of June 2011, as reported by Meteorological department, are given below. Construct a frequency table
                        for each.
                         Maximum temperature (in degree Celsius):
                         32.5, 30.5, 33.8, 31.0, 28.6, 33.9, 33.3, 32.4, 30.4, 32.6, 34.7, 31.9, 35.2, 35.3, 35.5,
                         36.4, 36.9, 37.0, 34.4, 32.5, 31.4, 34.4, 35.6, 37.3, 37.5, 36.9, 37.0, 36.3, 36.9, 36.7
                         Relative humidity (in percent):
                         90, 97, 92, 95, 93, 95, 93, 85, 83, 85, 83, 77, 83, 77, 74, 60, 71, 65, 74, 80, 87, 82,
                         81, 76, 61, 63, 58, 58, 56, 57
                      6.  The final marks in Mathematics of 30 students are as follows:
                         55, 60, 48, 65, 78, 42, 55, 100, 92, 35, 42, 55, 63, 31, 82, 84, 90, 95, 67, 58, 75, 81,
                         39, 72, 79, 93, 62, 54, 47, 41
                         (a)  Arrange these in groups 30–39, 40–49 and so on.   (b)  What is the lowest score?
                         (c)  What is the range of the given data?
                         (d)   How many got distinction (i.e., 75 and above)?   (e)  How many scored 90 and above?
                         (f)  If 40 is the passing mark, how many students failed?
                      7.  The following table shows the life expectancy (average age to which people live) in various countries in
                        a particular year. Represent the data in a bar graph.
                         Country                           China         India      Malaysia      Canada      England
                         Life expectancy (in years)          76           57           43           36           70
                      8.  The following data shows the percentage wins in ODI by top 8 cricket teams. Represent it in a double
                        bar graph.

                                                   South              Sri     New                          West
                         Teams                      Africa  Australia  Lanka  Zealand  England  Pakistan   Indies  India
                         From Champions Trophy      75%      61%      54%     47%       46%       45%       44%    43%
                         to World Cup-06
                         Last 10 ODI in 2007        78%      40%      38%     50%       40%       44%       30%    56%


                                                          Thinking Skills

                      1.  A study was conducted to find out the concentration of nitrogen dioxide (NO ) in the air (in parts per
                                                                                                 2
                        million) of a particular city. The data for 30 days is as follows:
                         0.017, 0.02, 0.018, 0.021, 0.014, 0.011, 0.023, 0.02, 0.019, 0.016, 0.025, 0.013, 0.012, 0.015, 0.021, 0.019,
                        0.026, 0.014, 0.022, 0.010, 0.017, 0.022, 0.024, 0.017, 0.022, 0.028, 0.029, 0.019, 0.028, 0.026.
                         Construct a grouped frequency distribution table with equal class intervals of width 0.004.
                      2.  Draw a bar graph to represent the data


                     320