Page 325 - Start Up Mathematics_8 (Non CCE)
P. 325

3.  Represent the data shown in the table below in the form of a bar graph.

                            Days                      Monday Tuesday Wednesday Thursday Friday Saturday Sunday
                            Number of cold drinks       20        15        20         30       10      12        24
                            sold (Frequency)

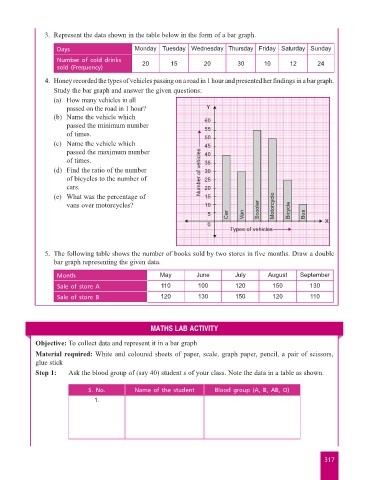
                        4.  Honey recorded the types of vehicles passing on a road in 1 hour and presented her findings in a bar graph.
                            Study the bar graph and answer the given questions:
                            (a)   How many vehicles in all
                               passed on the road in 1 hour?                 Y
                            (b)   Name the vehicle which                     60
                               passed the minimum number                     55
                               of times.                                     50
                            (c)   Name the vehicle which
                               passed the maximum number                     40
                               of times.                                     35
                            (d)   Find the ratio of the number             Number of vehicles 45
                                                                             30
                               of bicycles to the number of                  25
                               cars.                                         20
                            (e)   What was the percentage of                 15
                               vans over motorcycles?                        10                    Motorcycle
                                                                              5     Car  Van  Scooter   Bicycle  Bus
                                                                              0                                     X
                                                                                     Types of vehicles


                        5.  The following table shows the number of books sold by two stores in five months. Draw a double
                           bar graph representing the given data.

                            Month                             May         June         July      August     September
                            Sale of store A                   110         100          120         150         130
                            Sale of store B                   120         130          150         120         110


                                                           MATHS LAB ACTIVITY

                     Objective: To collect data and represent it in a bar graph

                     Material required: White and coloured sheets of paper, scale, graph paper, pencil, a pair of scissors,
                     glue stick
                     Step 1:    Ask the blood group of (say 40) student s of your class. Note the data in a table as shown.


                                       S. No.         Name of the student       Blood group (A, B, AB, O)
                                         1.


                                                                                                                    317
   320   321   322   323   324   325   326   327   328   329   330