
Page 326 - Start Up Mathematics_8 (Non CCE)
P. 326
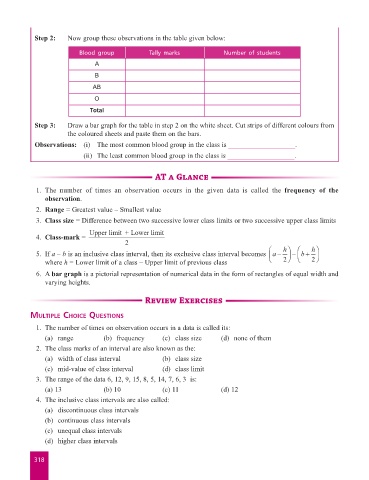
Step 2:    Now group these observations in the table given below:

                                    Blood group            Tally marks             Number of students

                                         A
                                         B
                                        AB

                                         O
                                       Total

                     Step 3:    Draw a bar graph for the table in step 2 on the white sheet. Cut strips of different colours from
                                the coloured sheets and paste them on the bars.
                     Observations:  (i)  The most common blood group in the class is ___________________.
                                     (ii)  The least common blood group in the class is ___________________.


                                                            AT a Glance

                      1.  The  number  of  times  an  observation  occurs  in  the  given  data  is  called  the  frequency of the
                        observation.
                      2.  Range = Greatest value – Smallest value
                      3.  Class size = Difference between two successive lower class limits or two successive upper class limits

                                       Upperlimit +Lower limit
                      4.  Class-mark =
                                                   2
                                                                                                  Ê
                      5.  If a – b is an inclusive class interval, then its exclusive class interval becomes  a -  hˆ  -  Ê Á b +  hˆ ˜
                                                                                                  Á
                                                                                                        ˜
                         where h = Lower limit of a class – Upper limit of previous class         Ë     ¯ 2  Ë   ¯ 2
                      6.  A bar graph is a pictorial representation of numerical data in the form of rectangles of equal width and
                        varying heights.


                                                         Review Exercises

                    Multiple ChoiCe Questions
                      1.  The number of times on observation occurs in a data is called its:
                         (a)  range         (b)  frequency     (c)  class size    (d)  none of them

                      2.  The class marks of an interval are also known as the:
                         (a)  width of class interval          (b)  class size
                         (c)  mid-value of class interval      (d)  class limit
                      3.  The range of the data 6, 12, 9, 15, 8, 5, 14, 7, 6, 3  is:
                         (a) 13             (b) 10             (c) 11             (d) 12
                      4.  The inclusive class intervals are also called:
                         (a)  discontinuous class intervals
                         (b)  continuous class intervals
                         (c)  unequal class intervals
                         (d)  higher class intervals


                     318