Page 324 - Start Up Mathematics_8 (Non CCE)
P. 324

Solution:    (a)  The given bar graph represents the number of students wearing shoes of different numbers
                                     out of a total of (500 + 300 + 400 + 800 + 500 + 100 + 400) 3,000 selected students.
                                 (b)  Students wear shoes of numbers 4, 5, 6, 7, 8, 9 and 10.
                                 (c)  Shoe number 7 is worn by maximum number of students. There are 800 students wearing it.
                                 (d)  Shoe number 9 is worn by minimum number of students. There are 100 students wearing it.
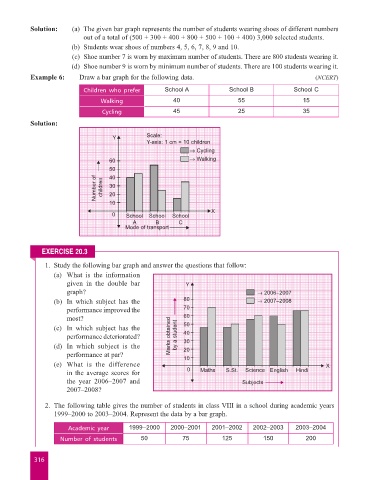
                    Example 6:      Draw a bar graph for the following data.                                     (NCERT)

                                     Children who prefer        School A             School B             School C
                                           Walking                40                    55                   15
                                           Cycling                45                    25                   35

                    Solution:

                                               Y          Scale:
                                                          Y-axis: 1 cm = 10 children
                                                                        Æ Cycling
                                             60                         Æ Walking
                                             50
                                             40
                                         Number of    children  30
                                             20
                                             10
                                                                               X
                                              0    School  School  School
                                                     A       B      C
                                                   Mode of transport


                       EXERCISE 20.3
                         1.  Study the following bar graph and answer the questions that follow:
                            (a)   What is the information
                                given in the double bar               Y
                                graph?                                                        Æ 2006–2007
                            (b)   In  which  subject  has  the        80                      Æ 2007–2008
                                performance improved the              70
                                most?                                 60
                            (c)   In  which  subject  has  the        50
                                performance deteriorated?        Marks obtained    by a student  40
                                                                      30
                            (d)   In  which  subject  is  the         20
                                performance at par?                   10
                            (e)   What is the difference                                                            X
                                in the average scores for              0   Maths    S.St.  Science English  Hindi
                                the  year  2006–2007  and                                Subjects
                                2007–2008?

                         2.  The following table gives the number of students in class VIII in a school during academic years
                           1999–2000 to 2003–2004. Represent the data by a bar graph.

                                Academic year       1999–2000     2000–2001    2001–2002    2002–2003     2003–2004
                             Number of students         50           75           125           150           200


                     316
   319   320   321   322   323   324   325   326   327   328   329