
Page 319 - Start Up Mathematics_8 (Non CCE)
P. 319
(ii) Inclusive (or Discontinuous) class intervals: When the class intervals are so arranged that the upper
limit of one class is not the lower limit of the next class, it is called inclusive or discontinuous class
interval. For example, 0–4, 5–9, 10–14, etc.
In this method, both the lower as well as the upper limit are included in the class.
Converting Inclusive Class Interval into Exclusive Class Interval
The data tabulated in the inclusive class interval method needs to be re-adjusted to exclusive class interval
method for easy comprehension and continuous class interval.
If a – b is a class of inclusive class interval, then in the corresponding exclusive class interval it becomes
Ê hˆ Ê hˆ
-
Á a - 2 ˜ Á b + ˜ , where h = (Lower limit of a class) – (Upper limit of previous class)
¯ Ë
Ë
¯ 2
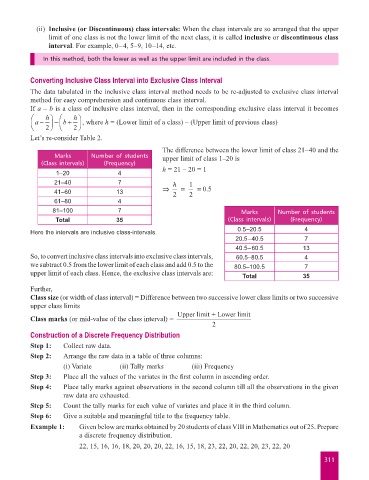
Let’s re-consider Table 2.
The difference between the lower limit of class 21–40 and the
Marks Number of students upper limit of class 1–20 is
(Class intervals) (Frequency)
1–20 4 h = 21 – 20 = 1
21–40 7 h 1
41–60 13 fi 2 = 2 = 05 .
61–80 4
81–100 7 Marks Number of students
Total 35 (Class intervals) (Frequency)
Here the intervals are inclusive class-intervals. 0.5–20.5 4
20.5–40.5 7
40.5–60.5 13
So, to convert inclusive class intervals into exclusive class intervals, 60.5–80.5 4
we subtract 0.5 from the lower limit of each class and add 0.5 to the 80.5–100.5 7
upper limit of each class. Hence, the exclusive class intervals are: Total 35
Further,
Class size (or width of class interval) = Difference between two successive lower class limits or two successive
upper class limits
Upperlimit +Lower limit
Class marks (or mid-value of the class interval) =
2
Construction of a Discrete Frequency Distribution
Step 1: Collect raw data.
Step 2: Arrange the raw data in a table of three columns:
(i) Variate (ii) Tally marks (iii) Frequency
Step 3: Place all the values of the variates in the first column in ascending order.
Step 4: Place tally marks against observations in the second column till all the observations in the given
raw data are exhausted.
Step 5: Count the tally marks for each value of variates and place it in the third column.
Step 6: Give a suitable and meaningful title to the frequency table.
Example 1: Given below are marks obtained by 20 students of class VIII in Mathematics out of 25. Prepare
a discrete frequency distribution.
22, 15, 16, 16, 18, 20, 20, 20, 22, 16, 15, 18, 23, 22, 20, 22, 20, 23, 22, 20
311