
Page 320 - Start Up Mathematics_8 (Non CCE)
P. 320
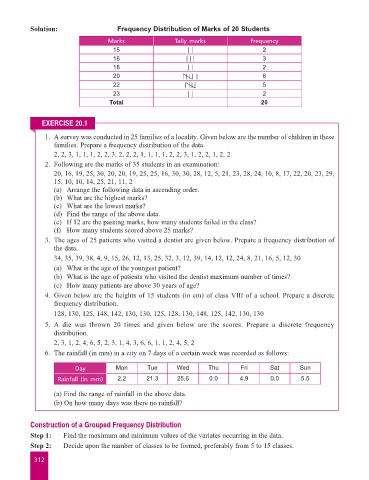
Solution:                   Frequency Distribution of Marks of 20 Students

                                             Marks                 Tally marks              Frequency
                                               15                      | |                      2
                                               16                      | | |                    3
                                               18                      | |                      2
                                               20                          |                    6
                                               22                                               5
                                               23                      | |                      2
                                             Total                                             20


                       EXERCISE 20.1
                         1.  A survey was conducted in 25 families of a locality. Given below are the number of children in these
                           families. Prepare a frequency distribution of the data.
                            2, 2, 3, 1, 1, 1, 2, 2, 3, 2, 2, 2, 1, 1, 1, 1, 2, 2, 3, 1, 2, 2, 1, 2, 2
                         2.  Following are the marks of 35 students in an examination:
                            20, 16, 19, 25, 30, 20, 20, 19, 25, 25, 16, 30, 30, 28, 12, 5, 21, 23, 28, 24, 10, 8, 17, 22, 20, 23, 29,
                           15, 10, 10, 14, 25, 21, 11, 2
                            (a)  Arrange the following data in ascending order.
                            (b)  What are the highest marks?
                            (c)  What are the lowest marks?
                            (d)  Find the range of the above data.
                            (e)  If 12 are the passing marks, how many students failed in the class?
                            (f)  How many students scored above 25 marks?
                         3.  The ages of 25 patients who visited a dentist are given below. Prepare a frequency distribution of
                           the data.
                            34, 35, 39, 38, 4, 9, 15, 26, 12, 13, 25, 32, 3, 12, 39, 14, 12, 12, 24, 8, 21, 16, 5, 12, 30
                            (a)  What is the age of the youngest patient?
                            (b)  What is the age of patients who visited the dentist maximum number of times?
                            (c)  How many patients are above 30 years of age?
                         4.  Given below are the heights of 15 students (in cm) of class VIII of a school. Prepare a discrete
                           frequency distribution.
                            128, 130, 125, 148, 142, 130, 130, 125, 128, 130, 148, 125, 142, 130, 130

                         5.  A  die  was  thrown  20  times  and  given  below  are  the  scores.  Prepare  a  discrete  frequency
                           distribution.
                            2, 3, 1, 2, 4, 6, 5, 2, 3, 1, 4, 3, 6, 6, 1, 1, 2, 4, 5, 2
                         6.  The rainfall (in mm) in a city on 7 days of a certain week was recorded as follows:


                                  Day           Mon       Tue       Wed       Thu       Fri       Sat       Sun
                             Rainfall (in mm)   2.2       21.3      25.6      0.0       4.9       0.0       5.5

                            (a) Find the range of rainfall in the above data.
                            (b) On how many days was there no rainfall?


                    Construction of a Grouped Frequency Distribution
                    Step 1:   Find the maximum and minimum values of the variates occurring in the data.
                    Step 2:   Decide upon the number of classes to be formed, preferably from 5 to 15 classes.

                     312