
Page 318 - Start Up Mathematics_8 (Non CCE)
P. 318
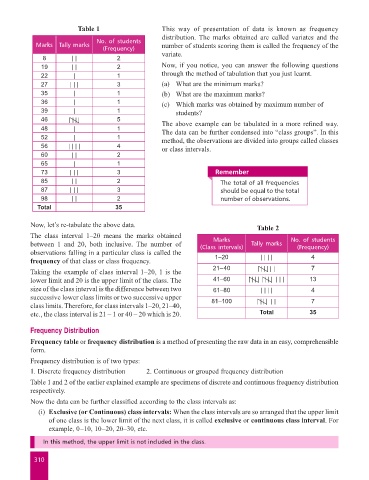
Table 1                     This  way  of  presentation  of  data  is  known  as  frequency
                                                               distribution.  The  marks obtained  are  called  variates  and the
                                         No. of students
                     Marks   Tally marks                       number of students scoring them is called the frequency of the
                                           (Frequency)
                        8        | |            2              variate.
                       19        | |            2              Now, if you notice, you can answer the following questions
                       22         |             1              through the method of tabulation that you just learnt.
                       27        | | |          3              (a)  What are the minimum marks?
                       35         |             1              (b)  What are the maximum marks?
                       36         |             1              (c)   Which marks was obtained by maximum number of
                       39         |             1                  students?
                       46                       5              The above example can be tabulated in a more refined way.
                       48         |             1              The data can be further condensed into “class groups”. In this
                       52         |             1              method, the observations are divided into groups called classes
                       56       | | | |         4              or class intervals.
                       60        | |            2
                       65         |             1
                       73        | | |          3                               Remember
                       85        | |            2                                 The total of all frequencies
                       87        | | |          3                                 should be equal to the total
                       98        | |            2                                 number of observations.
                      Total                    35

                    Now, let’s re-tabulate the above data.                                    Table 2
                    The  class  interval  1–20  means  the  marks  obtained    Marks                     No. of students
                    between  1  and  20,  both  inclusive.  The  number  of   (Class intervals)  Tally marks  (Frequency)
                    observations falling in a particular class is called the
                    frequency of that class or class frequency.                 1–20           | | | |          4
                    Taking the example of class interval 1–20, 1 is the        21–40              | |           7
                    lower limit and 20 is the upper limit of the class. The    41–60                 | | |     13
                    size of the class interval is the difference between two   61–80           | | | |          4
                    successive lower class limits or two successive upper      81–100              | |          7
                    class limits. Therefore, for class intervals 1–20, 21–40,
                    etc., the class interval is 21 – 1 or 40 – 20 which is 20.                 Total           35


                    Frequency Distribution
                    Frequency table or frequency distribution is a method of presenting the raw data in an easy, comprehensible
                    form.
                    Frequency distribution is of two types:
                    1. Discrete frequency distribution      2. Continuous or grouped frequency distribution
                    Table 1 and 2 of the earlier explained example are specimens of discrete and continuous frequency distribution
                    respectively.
                    Now the data can be further classified according to the class intervals as:
                      (i)  Exclusive (or Continuous) class intervals: When the class intervals are so arranged that the upper limit
                          of one class is the lower limit of the next class, it is called exclusive or continuous class interval. For
                          example, 0–10, 10–20, 20–30, etc.

                        In this method, the upper limit is not included in the class.

                     310