Page 332 - Start Up Mathematics_8 (Non CCE)
P. 332

EXERCISE 21.1


                         1.  Draw a histogram to represent the following data of the heights of 60 boys of a school:

                            Height (in cm)         125–130       130–135       135–140       140–145       145–150


                            No. of boys               12            14            18            10             6

                         2.  The following is the distribution of weights (in kg) of 50 persons:


                            Weight (in kg)         40–45       45–50       50–55       55–60       60–65      65–70

                            No. of persons           10          8           10          4           6          12


                            Draw a histogram for the above data and answer the following questions:
                            (a)   Which is the group with maximum number of
                                persons?
                            (b)  What is the class size?
                            (c)   Which is the group with minimum number of
                                persons?
                                                                                              Y
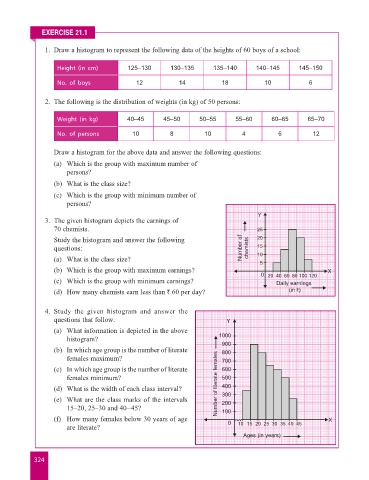
                         3.  The given histogram depicts the earnings of
                           70 chemists.                                                       25
                            Study the histogram and answer the following                      20
                           questions:                                                    Number of    chemists  15
                            (a)  What is the class size?                                      10
                                                                                               5
                            (b)  Which is the group with maximum earnings?                                           X
                                                                                               0  20  40  60  80  100 120
                            (c)  Which is the group with minimum earnings?                          Daily earnings
                            (d)  How many chemists earn less than ` 60 per day?                          (in `)


                         4.  Study the given histogram and answer the
                           questions that follow.                                   Y
                            (a)  What information is depicted in the above
                                histogram?                                       1000
                                                                                  900
                            (b)  In which age group is the number of literate     800
                                females maximum?                                  700
                            (c)  In which age group is the number of literate     600
                                females minimum?                                  500
                            (d)  What is the width of each class interval?       Number of literate females  400
                                                                                  300
                            (e)  What are the class marks of the intervals        200
                                15–20, 25–30 and 40–45?                           100
                            (f)  How many females below 30 years of age             0                                X
                                are literate?                                           10  15  20  25  30  35  40  45
                                                                                         Ages (in years)


                     324
   327   328   329   330   331   332   333   334   335   336   337