
Page 334 - Start Up Mathematics_8 (Non CCE)
P. 334
Reading a pie chart
The process of obtaining various information related to the given data from a given pie chart is known as
reading pie chart.
For reading a pie chart, we need to know the following results:
Central angle of the component Total of the component va¥ l lues
(i) Value of a component =
360
Central angle of the component 100¥
(ii) Percentage value of a component =
360
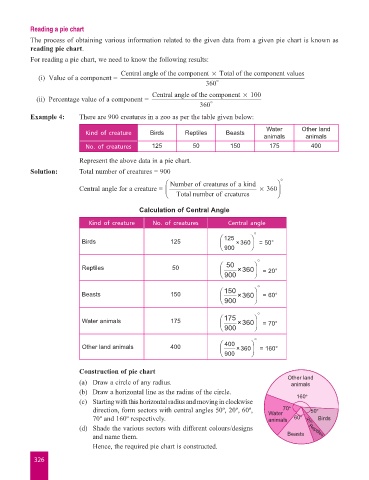
Example 4: There are 900 creatures in a zoo as per the table given below:
Water Other land
Kind of creature Birds Reptiles Beasts
animals animals
No. of creatures 125 50 150 175 400
Represent the above data in a pie chart.
Solution: Total number of creatures = 900
Ê Number of creatures ofa kind ˆ
Central angle for a creature = Á Total numberofcreatures ¥ 360 ˜ ¯
Ë
Calculation of Central Angle
Kind of creature No. of creatures Central angle
∞
Ê 125 ˆ
Birds 125 Á Ë 900 ×360 ˜ = 50°
¯
∞
50
Reptiles 50 Ê Á Ë 900 ×360 ˆ ˜ = 20°
¯
Beasts 150 Ê Á Ë 150 ×360 ˆ ˜ ¯ ∞ = 60°
900
Water animals 175 Ê Á Ë 175 ×360 ˆ ˜ ¯ ∞ = 70°
900
Other land animals 400 Ê Á Ë 400 ×360 ˆ ˜ ¯ ∞ = 160°
900
Construction of pie chart
Other land
(a) Draw a circle of any radius. animals
(b) Draw a horizontal line as the radius of the circle. 160º
(c) Starting with this horizontal radius and moving in clockwise
direction, form sectors with central angles 50º, 20º, 60º, Water 70º 50º
70º and 160º respectively. animals 60º Birds
(d) Shade the various sectors with different colours/designs 20° Reptiles
and name them. Beasts
Hence, the required pie chart is constructed.
326