
Page 336 - Start Up Mathematics_8 (Non CCE)
P. 336
The percentage can also be calculated using the given formula:
Number of students usinga particular mode of transport 100¥
Totalnumber oof students
EXERCISE 21.2
1. Draw a pie chart for the following data:
Transport to school Walk Bus Bicycle Metro Car
Number of students 400 1,000 200 300 100
2. The following data relates to the cost of construction of a house in Mumbai. Represent the data in a pie
chart.
Items Cement Steel Bricks Timber Labour Miscellaneous
Expenditure 30% 10% 10% 15% 25% 10%
3. In the month of October 2009, a house holder spent his monthly salary amounting to ` 7,200 on
different items as given below. Represent the information in the form of a pie chart.
Items Clothing Food House rent Education Miscellaneous
Amount spent (in `) 600 4,000 1,200 400 1,000
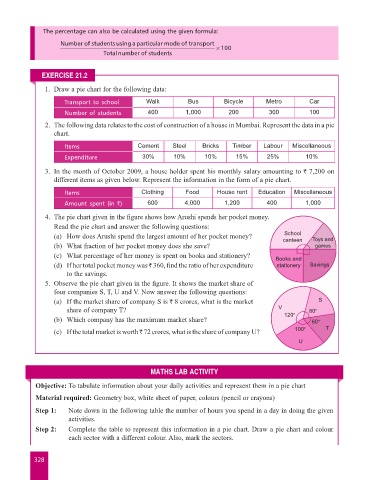
4. The pie chart given in the figure shows how Arushi spends her pocket money.
Read the pie chart and answer the following questions:
School
(a) How does Arushi spend the largest amount of her pocket money? canteen Toys and
(b) What fraction of her pocket money does she save? games
(c) What percentage of her money is spent on books and stationery? Books and
(d) If her total pocket money was ` 360, find the ratio of her expenditure stationery Savings
to the savings.
5. Observe the pie chart given in the figure. It shows the market share of
four companies S, T, U and V. Now answer the following questions:
(a) If the market share of company S is ` 8 crores, what is the market S
share of company T? V 80º
(b) Which company has the maximum market share? 120º 60º
(c) If the total market is worth ` 72 crores, what is the share of company U? 100º T
U
MATHS LAB ACTIVITY
Objective: To tabulate information about your daily activities and represent them in a pie chart
Material required: Geometry box, white sheet of paper, colours (pencil or crayons)
Step 1: Note down in the following table the number of hours you spend in a day in doing the given
activities.
Step 2: Complete the table to represent this information in a pie chart. Draw a pie chart and colour
each sector with a different colour. Also, mark the sectors.
328