
Page 340 - Start Up Mathematics_8 (Non CCE)
P. 340
3. Write the coordinates of the points shown in the given figures on the graph.
Y
S
4
3
P A
2
1 R C
X’ X
–5 –4 –3 –2 –1 0 1 2 3 4 5 6
–1 B
–2
Q
–3
Y’
4. Plot the following points on a graph. Do they lie on a straight line?
A(1, 3), B(–1, 1), C(0, –2), D(2, 4)
Construction of Graphs
While constructing graphs, the values of one variable changes corresponding to values of the other variable.
The variable whose value does not depend on the values of the other variable is called an independent
variable and the variable whose values depend on the values of the other variable is known as a dependent
variable.
To draw the graph of a given data, we use the following procedure:
Step 1: Identify independent and dependent variables from the given information.
Step 2: Label the independent variables along OX and dependent variables along OY.
Step 3: Choose an appropriate scale for plotting the points.
Step 4: Plot each ordered pair and join the plotted points to get the desired graph.
You can choose different scales along OX and OY.
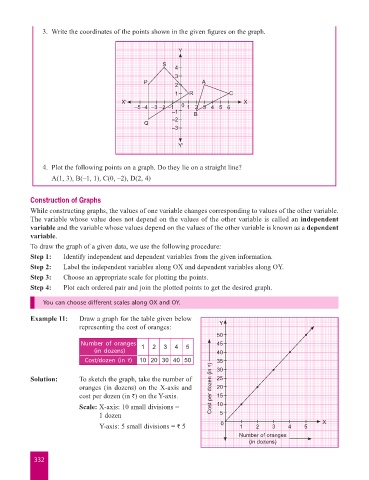
Example 11: Draw a graph for the table given below
representing the cost of oranges: Y
50
Number of oranges 1 2 3 4 5 45
(in dozens) 40
Cost/dozen (in `) 10 20 30 40 50 35
30
Solution: To sketch the graph, take the number of 25
oranges (in dozens) on the X-axis and Cost per dozen (in `) 20
cost per dozen (in `) on the Y-axis. 15
Scale: X-axis: 10 small divisions = 10
1 dozen 5
Y-axis: 5 small divisions = ` 5 0 1 2 3 4 5 X
Number of oranges
(in dozens)
332