Page 342 - Start Up Mathematics_8 (Non CCE)
P. 342

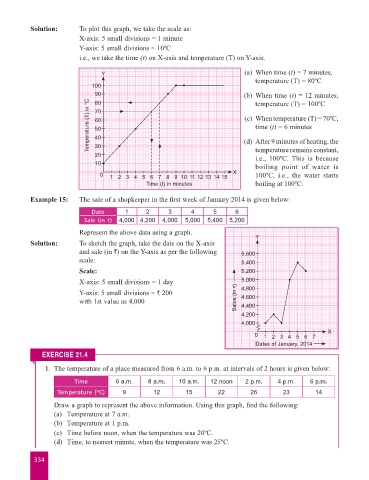
Solution:       To plot this graph, we take the scale as:
                                    X-axis: 5 small divisions = 1 minute
                                    Y-axis: 5 small divisions = 10ºC
                                    i.e., we take the time (t) on X-axis and temperature (T) on Y-axis.

                                           Y                                              (a)   When time (t) = 7 minutes,
                                                                                             temperature (T) = 80ºC
                                        100
                                         90                                               (b)   When time (t) = 12 minutes,
                                       Temperature (T) in °C  50                             time (t) = 6 minutes
                                         80
                                                                                             temperature (T) = 100ºC
                                         70                                               (c)   When temperature (T) = 70ºC,
                                         60

                                         40                                               (d)   After 9 minutes of heating, the
                                         30
                                         20                                                  temperature remains constant,
                                                                                             i.e., 100ºC.  This is because
                                         10                                                  boiling point of water is
                                          0   1 2 3 4 5 6 7 8 9 10 11 12 13 14 15     X      100ºC, i.e., the water starts
                                                          Time (t) in minutes                boiling at 100ºC.

                    Example 15:     The sale of a shopkeeper in the first week of January 2014 is given below:

                                        Date       1     2       3      4      5       6
                                     Sale (in  `)  4,000 4,200  4,000  5,000  5,400  5,200
                                    Represent the above data using a graph.
                                                                                             Y
                    Solution:       To sketch the graph, take the date on the X-axis
                                    and sale (in `) on the Y-axis as per the following    5,600
                                    scale:                                               5,400
                                    Scale:                                               5,200
                                    X-axis: 5 small divisions = 1 day                    5,000
                                    Y-axis: 5 small divisions = ` 200                    4,800
                                                                                         4,600
                                    with 1st value as 4,000                            Sales (in `)  4,400

                                                                                         4,200
                                                                                         4,000
                                                                                                                     X
                                                                                             0  1 2 3 4 5 6 7
                                                                                             Dates of January, 2014
                       EXERCISE 21.4

                         1.  The temperature of a place measured from 6 a.m. to 6 p.m. at intervals of 2 hours is given below:
                                  Time          6 a.m.    8 a.m.    10 a.m.   12 noon     2 p.m.     4 p.m.    6 p.m.

                            Temperature (ºC)      9         12        15         22         26        23         14
                            Draw a graph to represent the above information. Using this graph, find the following:
                            (a)  Temperature at 7 a.m.
                            (b)  Temperature at 1 p.m.
                            (c)  Time before noon, when the temperature was 20ºC.
                            (d)  Time, to nearest minute, when the temperature was 25ºC.

                     334
   337   338   339   340   341   342   343   344   345   346   347