
Page 347 - Start Up Mathematics_8 (Non CCE)
P. 347
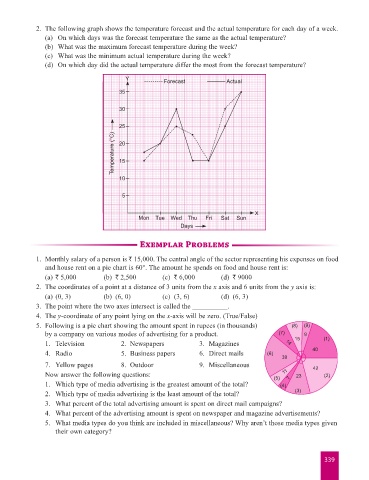
2.  The following graph shows the temperature forecast and the actual temperature for each day of a week.
                         (a)  On which days was the forecast temperature the same as the actual temperature?
                         (b)  What was the maximum forecast temperature during the week?
                         (c)  What was the minimum actual temperature during the week?
                         (d)  On which day did the actual temperature differ the most from the forecast temperature?

                                                   Y
                                                               Forecast             Actual
                                                 35


                                                 30

                                                 25
                                               Temperature (°C)  20


                                                 15

                                                 10

                                                  5


                                                                                             X
                                                       Mon   Tue  Wed  Thu   Fri  Sat  Sun
                                                                     Days

                                                       Exemplar Problems

                      1.  Monthly salary of a person is ` 15,000. The central angle of the sector representing his expenses on food
                        and house rent on a pie chart is 60°. The amount he spends on food and house rent is:
                         (a) ` 5,000        (b)  ` 2,500       (c)  ` 6,000       (d)  ` 9000
                      2.  The coordinates of a point at a distance of 3 units from the x axis and 6 units from the y axis is:
                         (a) (0, 3)         (b)  (6, 0)        (c)  (3, 6)        (d)  (6, 3)
                      3.  The point where the two axes intersect is called the __________.
                      4.  The y-coordinate of any point lying on the x-axis will be zero. (True/False)
                      5.  Following is a pie chart showing the amount spent in rupees (in thousands)     (8)  (9)
                        by a company on various modes of advertising for a product.                  (7)     9
                         1.  Television          2.  Newspapers            3.  Magazines               14  15       (1)
                         4.  Radio               5.  Business papers       6.  Direct mails      (6)            40
                                                                                                      39
                         7.  Yellow pages        8.  Outdoor               9.  Miscellaneous                    42
                         Now answer the following questions:                                       (5)  11  7  23   (2)
                         1.  Which type of media advertising is the greatest amount of the total?    (4)
                         2.  Which type of media advertising is the least amount of the total?            (3)
                         3.  What percent of the total advertising amount is spent on direct mail campaigns?
                         4.  What percent of the advertising amount is spent on newspaper and magazine advertisements?
                         5.   What media types do you think are included in miscellaneous? Why aren’t those media types given
                            their own category?


                                                                                                                    339