
Page 344 - Start Up Mathematics_8 (Non CCE)
P. 344
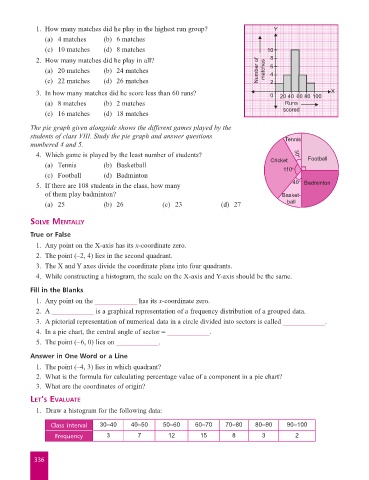
1.  How many matches did he play in the highest run group?                   Y
                         (a)  4 matches     (b)  6 matches
                         (c)  10 matches    (d)  8 matches                                       10

                      2.  How many matches did he play in all?                                    8
                         (a)  20 matches    (b)  24 matches                                   Number of    matches  6
                                                                                                  4
                         (c)  22 matches    (d)  26 matches                                       2
                      3.  In how many matches did he score less than 60 runs?                     0  20 40  60 80 100  X

                         (a)  8 matches     (b)  2 matches                                             Runs
                                                                                                      scored
                         (c)  16 matches    (d)  18 matches
                    The pie graph given alongside shows the different games played by the
                    students of class VIII. Study the pie graph and answer questions                   Tennis
                    numbered 4 and 5.
                      4.  Which game is played by the least number of students?                            30º
                                                                                                  Cricket     Football
                         (a)  Tennis        (b)  Basketball                                           110º
                         (c)  Football      (d)  Badminton
                      5.  If there are 108 students in the class, how many                               40º  Badminton
                        of them play badminton?                                                       Basket-
                        (a)  25             (b)  26            (c)  23            (d)  27               ball


                    solve Mentally
                    True or False
                      1.  Any point on the X-axis has its x-coordinate zero.

                      2.  The point (–2, 4) lies in the second quadrant.
                      3.  The X and Y axes divide the coordinate plane into four quadrants.
                      4.  While constructing a histogram, the scale on the X-axis and Y-axis should be the same.

                    Fill in the Blanks
                      1.  Any point on the ____________ has its x-coordinate zero.
                      2.  A ____________ is a graphical representation of a frequency distribution of a grouped data.
                      3.  A pictorial representation of numerical data in a circle divided into sectors is called ____________.
                      4.  In a pie chart, the central angle of sector = ____________.
                      5.  The point (–6, 0) lies on ____________.

                    Answer in One Word or a Line
                      1.  The point (–4, 3) lies in which quadrant?
                      2.  What is the formula for calculating percentage value of a component in a pie chart?
                      3.  What are the coordinates of origin?

                    let’s evaluate
                      1.   Draw a histogram for the following data:

                          Class interval  30–40      40–50     50–60      60–70    70–80     80–90      90–100

                            Frequency        3         7         12        15         8        3          2


                     336