
Page 345 - Start Up Mathematics_8 (Non CCE)
P. 345
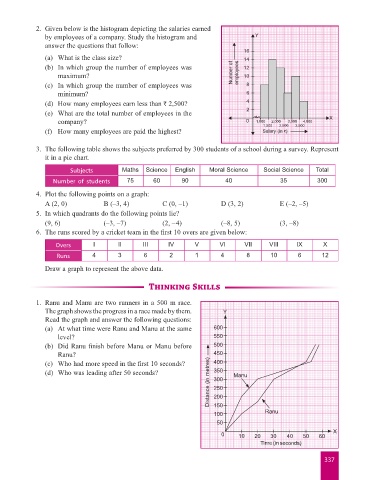
2.  Given below is the histogram depicting the salaries earned
                        by employees of a company. Study the histogram and                   Y
                        answer the questions that follow:
                                                                                         16
                         (a)  What is the class size?                                    14
                         (b)  In which group the number of employees was                 12
                             maximum?                                                 Number of   employees  10
                         (c)  In which group the number of employees was                  8
                             minimum?                                                     6
                         (d)  How many employees earn less than ` 2,500?                  4
                         (e)  What are the total number of employees in the               2
                             company?                                                     0  1,000  2,000  3,000  4,000  X
                                                                                                1,500  2,500   3,500
                         (f)  How many employees are paid the highest?                          Salary (in `)


                      3.  The following table shows the subjects preferred by 300 students of a school during a survey. Represent
                        it in a pie chart.

                                 Subjects         Maths  Science   English    Moral Science     Social Science   Total

                           Number of students      75       60       90            40                35          300
                      4.  Plot the following points on a graph:
                         A (2, 0)           B (–3, 4)          C (0, –1)          D (3, 2)           E (–2, –5)
                      5.  In which quadrants do the following points lie?
                         (9, 6)             (–3, –7)           (2, –4)            (–8, 5)            (3, –8)
                      6.  The runs scored by a cricket team in the first 10 overs are given below:

                            Overs       I       II      III      IV      V        VI      VII     VIII     IX      X
                            Runs        4       3        6       2        1       4       8       10       6       12
                         Draw a graph to represent the above data.


                                                          Thinking Skills

                      1.  Ranu and Manu are two runners in a 500 m race.
                        The graph shows the progress in a race made by them.       Y
                        Read the graph and answer the following questions:
                         (a)   At what time were Ranu and Manu at the same      600
                             level?                                             550
                         (b)   Did Ranu finish before Manu or Manu before       500
                             Ranu?                                              450
                                                                              Distance (in metres)  300
                         (c)  Who had more speed in the first 10 seconds?       400
                         (d)   Who was leading after 50 seconds?                350   Manu


                                                                                250
                                                                                200
                                                                                150
                                                                                100             Ranu
                                                                                 50
                                                                                                                       X
                                                                                  0     10   20   30    40   50   60
                                                                                               Time (in seconds)

                                                                                                                    337