
Page 243 - ICSE Math 6
P. 243
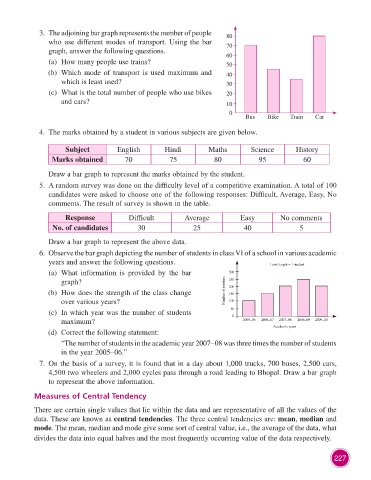
3.  The adjoining bar graph represents the number of people   80
                        who use different modes of transport. Using the bar         70
                        graph, answer the following questions.                      60
                        (a)  How many people use trains?                            50
                        (b)  Which  mode  of transport is used maximum and          40
                             which is least used?                                   30

                        (c)  What is the total number of people who use bikes       20
                             and cars?                                              10

                                                                                     0
                                                                                          Bus    Bike    Train   Car

                      4.  The marks obtained by a student in various subjects are given below.

                              Subject          English         Hindi          Maths         Science        History
                          Marks obtained          70             75             80            95             60


                         Draw a bar graph to represent the marks obtained by the student.
                      5.  A random survey was done on the difficulty level of a competitive examination. A total of 100
                        candidates were asked to choose one of the following responses: Difficult, Average, Easy, No
                        comments. The result of survey is shown in the table.

                              Response             Difficult          Average           Easy          No comments
                          No. of candidates           30                 25               40                5

                         Draw a bar graph to represent the above data.
                      6.  Observe the bar graph depicting the number of students in class VI of a school in various academic
                        years and answer the following questions.                                 1 unit length = 1 student
                        (a)   What information is provided by the bar               300
                             graph?                                                 250
                        (b)   How does the strength of the class change            Number of students   200
                                                                                    150
                             over various years?                                    100
                        (c)   In which year was the number of students               50 0
                             maximum?                                                    2005–06  2006–07  2007–08  2008–09  2009–10
                                                                                                   Academic years
                        (d)  Correct the following statement:
                              “The number of students in the academic year 2007–08 was three times the number of students
                             in the year 2005–06.”
                      7.  On the basis of a survey, it is found that in a day about 1,000 trucks, 700 buses, 2,500 cars,
                        4,500 two wheelers and 2,000 cycles pass through a road leading to Bhopal. Draw a bar graph
                        to represent the above information.

                    Measures of Central Tendency

                    There are certain single values that lie within the data and are representative of all the values of the
                    data. These are known as central tendencies. The three central tendencies are: mean, median and
                    mode. The mean, median and mode give some sort of central value, i.e., the average of the data, what
                    divides the data into equal halves and the most frequently occurring value of the data respectively.


                                                                                                                        227