
Page 247 - ICSE Math 6
P. 247
2. The table given below shows some of the favourite activities of students of a class.
Activity Playing Sports Watching TV Reading Books Visiting Friends
Number of students 25 20 15 10
Represent this data using a bar graph.
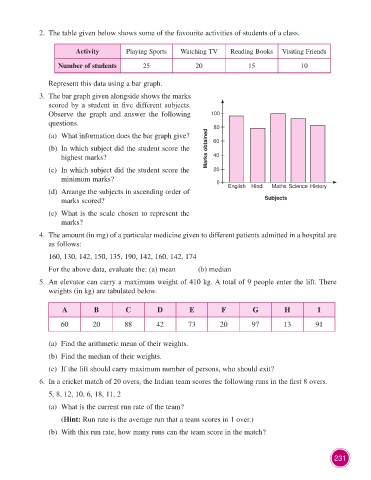
3. The bar graph given alongside shows the marks
scored by a student in five different subjects.
Observe the graph and answer the following 100
questions.
80
(a) What information does the bar graph give? 60
(b) In which subject did the student score the Marks obtained
highest marks? 40
(c) In which subject did the student score the 20
minimum marks?
0 English Hindi Maths Science History
(d) Arrange the subjects in ascending order of
marks scored? Subjects
(e) What is the scale chosen to represent the
marks?
4. The amount (in mg) of a particular medicine given to different patients admitted in a hospital are
as follows:
160, 130, 142, 150, 135, 190, 142, 160, 142, 174
For the above data, evaluate the: (a) mean (b) median
5. An elevator can carry a maximum weight of 410 kg. A total of 9 people enter the lift. There
weights (in kg) are tabulated below.
A B C D E F G H I
60 20 88 42 73 20 97 13 91
(a) Find the arithmetic mean of their weights.
(b) Find the median of their weights.
(c) If the lift should carry maximum number of persons, who should exit?
6. In a cricket match of 20 overs, the Indian team scores the following runs in the first 8 overs.
5, 8, 12, 10, 6, 18, 11, 2
(a) What is the current run rate of the team?
(Hint: Run rate is the average run that a team scores in 1 over.)
(b) With this run rate, how many runs can the team score in the match?
231