
Page 246 - ICSE Math 6
P. 246
4. The time (in minutes) Sameer took to solve different Maths test papers are given below.
10, 25, 31, 19, 13, 26, 19, 26, 26, 20
Arrange the given data in ascending order and answer the following questions.
(a) What is the least and greatest time that Sameer took to solve a test paper?
(b) What is the mean and median of the data?
AT A GLANCE
¾ Data is the information collected in the form of numbers or facts.
¾ In a pictograph, numbers are represented using pictures or symbols.
¾ Bar graph is the representation of data using columns or bars of uniform width.
¾ The three central tendencies are mean, median and mode.
Sum of all observations
¾ Mean =
Total number of observations
¾ The median of a data is the middle observation when all observations of the data are arranged
in an order.
MENTAL MATHS
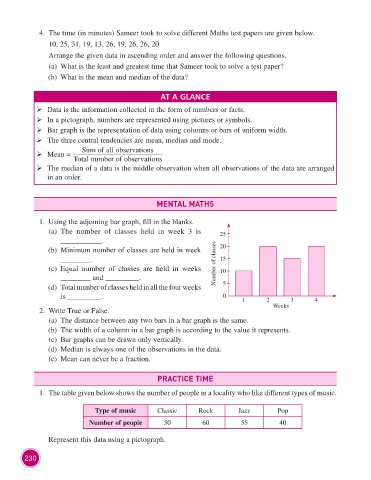
1. Using the adjoining bar graph, fill in the blanks.
(a) The number of classes held in week 3 is 25
___________.
(b) Minimum number of classes are held in week 20
________. 15
(c) Equal number of classes are held in weeks Number of classes 10
________ and _________.
(d) Total number of classes held in all the four weeks 5
is _________. 0 1 2 3 4
Weeks
2. Write True or False.
(a) The distance between any two bars in a bar graph is the same.
(b) The width of a column in a bar graph is according to the value it represents.
(c) Bar graphs can be drawn only vertically.
(d) Median is always one of the observations in the data.
(e) Mean can never be a fraction.
PRACTICE TIME
1. The table given below shows the number of people in a locality who like different types of music.
Type of music Classic Rock Jazz Pop
Number of people 50 60 55 40
Represent this data using a pictograph.
230