Page 242 - ICSE Math 6
P. 242

Using the bar graph, answer the following questions.
                                  (a)  Which game is played by the maximum number of children?
                                  (b)  Which game is played by the minimum number of children?
                                  (c)  What is the difference in the number of children who play chess and cricket?

                    Solution:     (a)  Chess
                                  (b)  Football
                                  (c)  Number of children who play chess = 60
                                      Number of children who play cricket = 45
                                      \ Difference = 60 – 45 = 15

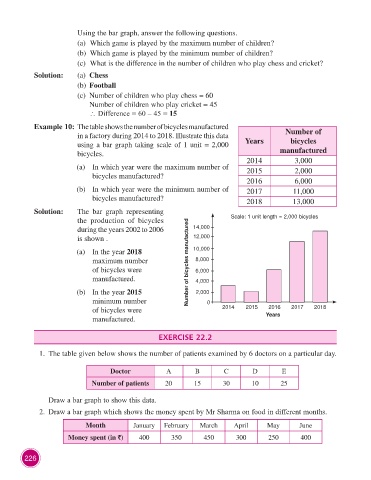
                    Example 10: The table shows the number of bicycles manufactured
                                  in a factory during 2014 to 2018. Illustrate this data               Number of
                                  using a bar graph taking scale of 1 unit = 2,000        Years          bicycles
                                  bicycles.                                                          manufactured
                                                                                          2014            3,000
                                  (a)  In which year were the maximum number of           2015            2,000
                                       bicycles manufactured?
                                                                                          2016            6,000
                                  (b)  In which year were the minimum number of           2017            11,000
                                       bicycles manufactured?                             2018            13,000
                    Solution:     The bar graph represent ing
                                  the production of bicycles                         Scale: 1 unit length = 2,000 bicycles
                                  during the years 2002 to 2006          14,000
                                  is shown .                             12,000

                                  (a)  In the year 2018                  10,000
                                       maxi mum number                 Number of bicycles manufactured  8,000
                                       of bicycles were                  6,000
                                       manufactured.                     4,000

                                  (b)  In the year 2015                  2,000
                                       mini mum number                       0
                                       of bicycles were                           2014    2015    2016   2017    2018
                                       manufactured.                                             Years


                                                             EXERCISE 22.2

                      1.  The table given below shows the number of patients examined by 6 doctors on a particular day.


                                             Doctor             A        B         C        D         E
                                       Number of patients      20        15       30        10        25


                         Draw a bar graph to show this data.
                      2.  Draw a bar graph which shows the money spent by Mr Sharma on food in different months.

                                     Month           January   February    March      April      May        June
                               Money spent (in `)      400       350        450        300        250       400


                226
   237   238   239   240   241   242   243   244   245   246   247