
Page 237 - ICSE Math 6
P. 237
Solution: (a) The given data is arranged in the following table.
Subjects Tally marks No. of students
Maths 12
History 3
Art and craft 6
Science 9
(b) Clearly, Maths is the most favourite subject of the students.
Pictograph
In a pictograph, numbers are represented using pictures or symbols. Such representation is useful for
clear understanding and also for making comparisons. A pictograph will always has a key explaining
what each picture stands for.
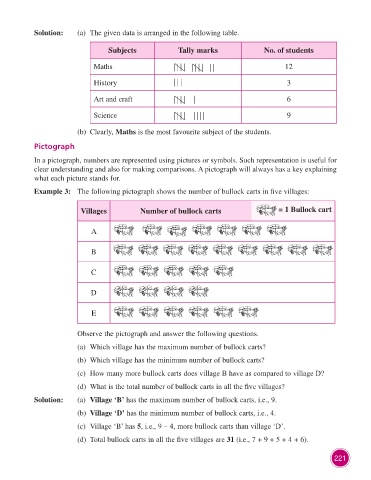
Example 3: The following pictograph shows the number of bullock carts in five villages:
Villages Number of bullock carts = 1 Bullock cart
A
B
C
D
E
Observe the pictograph and answer the following questions.
(a) Which village has the maximum number of bullock carts?
(b) Which village has the minimum number of bullock carts?
(c) How many more bullock carts does village B have as compared to village D?
(d) What is the total number of bullock carts in all the five villages?
Solution: (a) Village ‘B’ has the maximum number of bullock carts, i.e., 9.
(b) Village ‘D’ has the minimum number of bullock carts, i.e., 4.
(c) Village ‘B’ has 5, i.e., 9 – 4, more bullock carts than village ‘D’.
(d) Total bullock carts in all the five villages are 31 (i.e., 7 + 9 + 5 + 4 + 6).
221