
Page 241 - ICSE Math 6
P. 241
Construction of a bar graph
Following are the steps to construct a bar graph.
Step 1: On a graph sheet, draw two mutually perpendicular lines. One line should be horizontal
and the other vertical.
Step 2: Choose a suitable scale on one of the lines drawn. Draw bars of equal width such that the
height or length of the bars should be proportional to the corresponding numerical values.
Properties of bar graphs
1. Bars can be either horizontal or vertical.
2. The height or length of a bar represents the numerical value of the data.
3. The width of each bar is kept the same, though it is merely for attraction.
4. The distance between any two consecutive bars should be equal.
5. Bars can be shaded, hatched or coloured to make them look attractive.
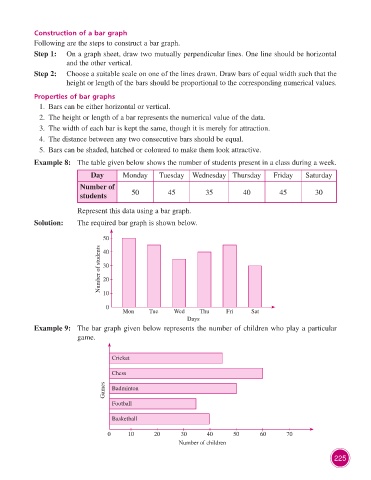
Example 8: The table given below shows the number of students present in a class during a week.
Day Monday Tuesday Wednesday Thursday Friday Saturday
Number of
students 50 45 35 40 45 30
Represent this data using a bar graph.
Solution: The required bar graph is shown below.
50
Number of students 30
40
20
10
0
Mon Tue Wed Thu Fri Sat
Days
Example 9: The bar graph given below represents the number of children who play a particular
game.
Cricket
Chess
Games Badminton
Football
Basketball
0 10 20 30 40 50 60 70
Number of children
225