
Page 240 - ICSE Math 6
P. 240
EXERCISE 22.1
1. The numbers of children in twenty-five families of a colony are given.
2, 3, 4, 1, 1, 2, 3, 1, 2, 2, 1, 1, 3, 2, 1, 2, 3, 2, 2, 2, 3, 2, 2, 1, 2
Organize the above data in a table and answer the following questions.
(a) What is the minimum number of children in a family?
(b) What is the maximum number of children in a family?
(c) What is the most common number of children in a family?
(d) How many families have 2 children?
2. On throwing a die twenty-four times, the following digits are appeared.
3, 5, 6, 2, 5, 2, 4, 2, 1, 2, 3, 6, 1, 2, 5, 4, 2, 2, 5, 4, 3, 2, 5, 6
Prepare a table using tally marks for the above data and answer the following questions.
(a) Which digit is appeared the maximum number of times?
(b) Which digit is appeared the minimum number of times?
(c) Which digits are appeared an equal number of times?
3. The data given below represents the different sizes of shirts which were sold at a garment store
on a particular day.
32, 36, 32, 38, 40, 44, 40, 38, 40, 32, 42, 40, 40, 38, 34, 36, 38, 34, 40, 40, 40, 34, 40, 42, 44,
42, 40, 40, 44, 40
Prepare a table using tally marks for the above data and answer the following questions.
(a) Which shirt size had the maximum sale?
(b) Which shirt size had the minimum sale?
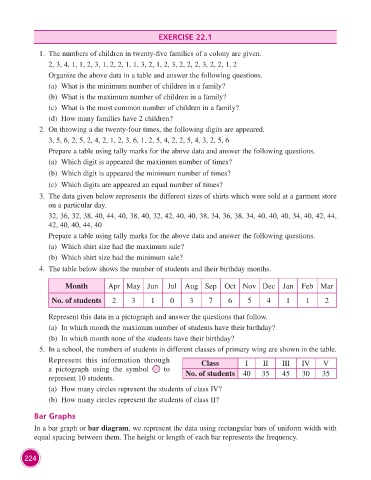
4. The table below shows the number of students and their birthday months.
Month Apr May Jun Jul Aug Sep Oct Nov Dec Jan Feb Mar
No. of students 2 3 1 0 3 7 6 5 4 1 1 2
Represent this data in a pictograph and answer the questions that follow.
(a) In which month the maximum number of students have their birthday?
(b) In which month none of the students have their birthday?
5. In a school, the numbers of students in different classes of primary wing are shown in the table.
Represent this information through Class I II III IV V
a pictograph using the symbol to No. of students 40 35 45 30 35
represent 10 students.
(a) How many circles represent the students of class IV?
(b) How many circles represent the students of class II?
Bar Graphs
In a bar graph or bar diagram, we represent the data using rectangular bars of uniform width with
equal spacing between them. The height or length of each bar represents the frequency.
224