
Page 238 - ICSE Math 6
P. 238
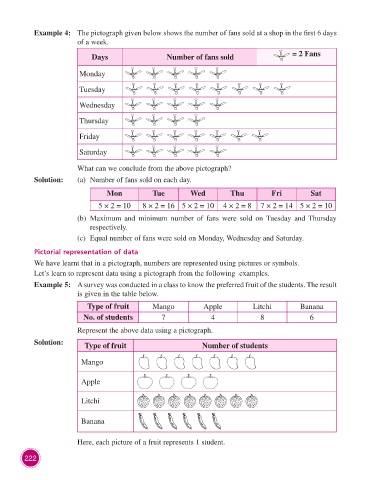
Example 4:  The pictograph given below shows the number of fans sold at a shop in the first 6 days
                                  of a week.

                                       Days                     Number of fans sold                       = 2 Fans


                                   Monday

                                   Tuesday

                                   Wednesday

                                   Thursday

                                   Friday

                                   Saturday

                                  What can we conclude from the above pictograph?

                    Solution:     (a)  Number of fans sold on each day.

                                            Mon            Tue          Wed          Thu           Fri          Sat
                                         5 × 2 = 10     8 × 2 = 16 5 × 2 = 10      4 × 2 = 8   7 × 2 = 14 5 × 2 = 10

                                  (b)   Maximum and minimum number of fans were sold on  Tuesday and  Thursday
                                      respectively.
                                  (c)  Equal number of fans were sold on Monday, Wednesday and Saturday.

                    Pictorial representation of data
                    We have learnt that in a pictograph, numbers are represented using pictures or symbols.
                    Let’s learn to represent data using a pictograph from the following  examples.

                    Example 5:  A survey was conducted in a class to know the preferred fruit of the students. The result
                                  is given in the table below.

                                     Type of fruit         Mango            Apple            Litchi         Banana
                                    No. of students           7                4               8               6

                                  Represent the above data using a pictograph.
                    Solution:       Type of fruit                           Number of students


                                   Mango


                                   Apple


                                   Litchi


                                   Banana


                                  Here, each picture of a fruit represents 1 student.


                222