
Page 86 - Viva ICSE Computer Studies 5 : E-book
P. 86
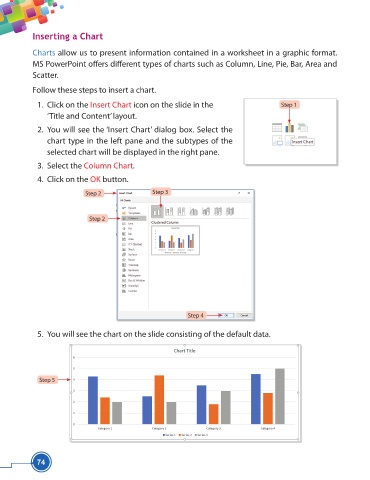
Inserting a Chart


                    Charts allow us to present information contained in a worksheet in a graphic format.
                    MS PowerPoint off ers diff erent types of charts such as Column, Line, Pie, Bar, Area and

                    Scatter.

                    Follow these steps to insert a chart.

                      1.  Click on the Insert Chart icon on the slide in the                          Step 1
                        ‘Title and Content’ layout.

                      2.  You will see the ‘Insert Chart’ dialog box. Select the
                        chart type in the left pane and the subtypes of the

                        selected chart will be displayed in the right pane.
                     3.  Select the Column Chart.

                      4.  Click on the OK button.

                                     Step 2                Step 3


                                      Step 2


                                                                       Step 4

                      5.  You will see the chart on the slide consisting of the default data.


                      Step 5


                     74