Page 88 - Viva ICSE Computer Studies 5 : E-book
P. 88

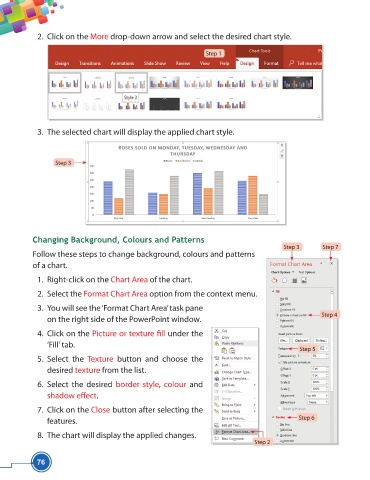
2.  Click on the More drop-down arrow and select the desired chart style.

                                                                             Step 1


                      3.  The selected chart will display the applied chart style.


                           Step 3


                    Changing Background, Colours and Patterns
                                                                                                       Step 3       Step 7
                    Follow these steps to change background, colours and patterns
                    of a chart.

                      1.  Right-click on the Chart Area of the chart.

                     2.  Select the Format Chart Area option from the context menu.

                      3.  You will see the ‘Format Chart Area’ task pane
                                                                                                                   Step 4
                        on the right side of the PowerPoint window.

                      4.  Click on the Picture or texture fi ll under the
                        ‘Fill’ tab.
                                                                                                            Step 5
                     5.  Select  the  Texture  button and choose the
                        desired texture from the list.


                      6.  Select the desired  border style,  colour  and
                        shadow eff ect.

                      7.  Click on the Close button after selecting the
                        features.                                                                           Step 6

                      8.  The chart will display the applied changes.
                                                                                             Step 2


                     76
   83   84   85   86   87   88   89   90   91   92   93