Page 262 - ICSE Math 8
P. 262

Construction of pie chart
                                  (a)  Draw a circle of any radius.                                     Other land
                                  (b)  Draw a horizontal line as the radius of the circle.               animals
                                  (c)   Starting with this horizontal radius and moving in clockwise       160º
                                      direction, form sectors with central angles 50º, 20º, 60º, 70º   70º     50º
                                      and 160º respectively.                                     Water    60º     Birds
                                  (d)    Shade the various sectors with different colours/designs and   animals  20°
                                      name them.                                                        Beasts  Reptiles
                                  Hence, the required pie chart is constructed.
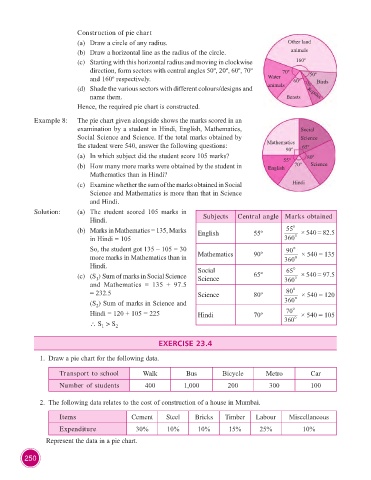
                    Example 8:    The pie chart given alongside shows the marks scored in an
                                  examination by a student in Hindi, English, Mathematics,                  Social
                                  Social Science and Science. If the total marks obtained by                Science
                                  the student were 540, answer the following questions:          Mathematics  65º
                                                                                                       90º
                                  (a)  In which subject did the student score 105 marks?               55º     80º
                                  (b)   How many more marks were obtained by the student in       English  70º  Science
                                      Mathematics than in Hindi?
                                  (c)   Examine whether the sum of the marks obtained in Social           Hindi
                                      Science and Mathematics is more than that in Science
                                      and Hindi.

                    Solution:     (a)    The  student  scored  105  marks  in   Subjects  Central angle Marks obtained
                                      Hindi.
                                  (b)    Marks in Mathematics = 135, Marks   English         55º        55    × 540 = 82.5
                                      in Hindi = 105                                                   360 
                                        So, the student got 135 – 105 = 30                              90 
                                      more marks in Mathematics than in   Mathematics        90º       360    × 540 = 135
                                      Hindi.                              Social                        65 
                                  (c)   (S )  Sum of marks in Social Science   Science       65º       360    × 540 = 97.5
                                        1
                                      and  Mathematics  =  135  +  97.5                                   
                                      = 232.5                             Science            80º        80     × 540 = 120
                                        (S ) Sum of marks in Science and                               360
                                        2
                                      Hindi = 120 + 105 = 225             Hindi              70º        70     × 540 = 105
                                      \ S  > S 2                                                       360
                                          1

                                                             EXERCISE 23.4

                      1.  Draw a pie chart for the following data.

                            Transport to school         Walk          Bus         Bicycle        Metro          Car

                            Number of students           400         1,000          200           300           100

                      2.  The following data relates to the cost of construction of a house in Mumbai.

                            Items                   Cement      Steel    Bricks    Timber     Labour     Miscellaneous

                            Expenditure               30%       10%       10%       15%        25%           10%
                        Represent the data in a pie chart.


                250
   257   258   259   260   261   262   263   264   265   266   267