
Page 258 - ICSE Math 8
P. 258
Reading a bar graph
We can draw certain conclusion after studying a given bar graph. The process of obtaining various information
related to the given data from a bar graph is known as reading the bar graph.
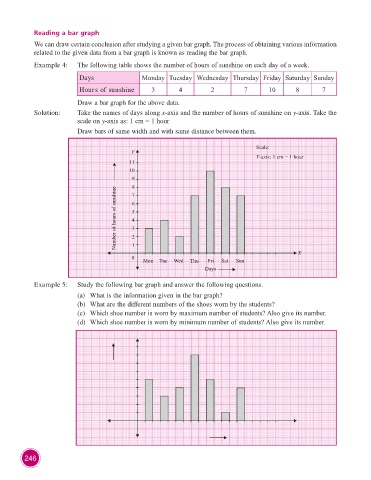
Example 4: The following table shows the number of hours of sunshine on each day of a week.
Days Monday Tuesday Wednesday Thursday Friday Saturday Sunday
Hours of sunshine 3 4 2 7 10 8 7
Draw a bar graph for the above data.
Solution: Take the names of days along x-axis and the number of hours of sunshine on y-axis. Take the
scale on y-axis as: 1 cm = 1 hour
Draw bars of same width and with same distance between them.
Scale:
Y
Y-axis: 1 cm = 1 hour
11
10
9
8 7
Number of hours of sunshine 6 5 4 3 2
0 1 X
Mon Tue Wed Thu Fri Sat Sun
Days
Example 5: Study the following bar graph and answer the following questions.
(a) What is the information given in the bar graph?
(b) What are the different numbers of the shoes worn by the students?
(c) Which shoe number is worn by maximum number of students? Also give its number.
(d) Which shoe number is worn by minimum number of students? Also give its number.
Y Scale:
900 Y-axis: 1 cm = 100 students
800
700
Number of students 500
600
400
300
200
100
No. 4 No. 5 No. 6 No. 7 No. 8 No. 9 No. 10
0 X
Shoe numbers
246