
Page 257 - ICSE Math 8
P. 257
EXERCISE 23.2
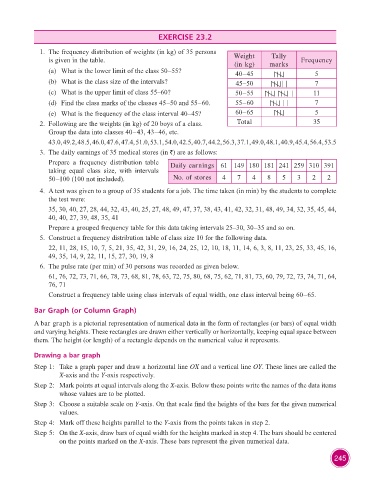
1. The frequency distribution of weights (in kg) of 35 persons Weight Tally
is given in the table. (in kg) marks Frequency
(a) What is the lower limit of the class 50–55? 40–45 5
(b) What is the class size of the intervals? 45–50 | | 7
(c) What is the upper limit of class 55–60? 50–55 | 11
(d) Find the class marks of the classes 45–50 and 55–60. 55–60 | | 7
(e) What is the frequency of the class interval 40–45? 60–65 5
2. Following are the weights (in kg) of 20 boys of a class. Total 35
Group the data into classes 40–43, 43–46, etc.
43.0, 49.2, 48.5, 46.0, 47.6, 47.4, 51.0, 53.1, 54.0, 42.5, 40.7, 44.2, 56.3, 37.1, 49.0, 48.1, 40.9, 45.4, 56.4, 53.5
3. The daily earnings of 35 medical stores (in `) are as follows:
Prepare a frequency distribution table Daily earnings 61 149 180 181 241 259 310 391
taking equal class size, with intervals
50–100 (100 not included). No. of stores 4 7 4 8 5 3 2 2
4. A test was given to a group of 35 students for a job. The time taken (in min) by the students to complete
the test were:
35, 30, 40, 27, 28, 44, 32, 43, 40, 25, 27, 48, 49, 47, 37, 38, 43, 41, 42, 32, 31, 48, 49, 34, 32, 35, 45, 44,
40, 40, 27, 39, 48, 35, 41
Prepare a grouped frequency table for this data taking intervals 25–30, 30–35 and so on.
5. Construct a frequency distribution table of class size 10 for the following data.
22, 11, 28, 15, 10, 7, 5, 21, 35, 42, 31, 29, 16, 24, 25, 12, 10, 18, 11, 14, 6, 3, 8, 11, 23, 25, 33, 45, 16,
49, 35, 14, 9, 22, 11, 15, 27, 30, 19, 8
6. The pulse rate (per min) of 30 persons was recorded as given below.
61, 76, 72, 73, 71, 66, 78, 73, 68, 81, 78, 63, 72, 75, 80, 68, 75, 62, 71, 81, 73, 60, 79, 72, 73, 74, 71, 64,
76, 71
Construct a frequency table using class intervals of equal width, one class interval being 60–65.
Bar Graph (or Column Graph)
A bar graph is a pictorial representation of numerical data in the form of rectangles (or bars) of equal width
and varying heights. These rectangles are drawn either vertically or horizontally, keeping equal space between
them. The height (or length) of a rectangle depends on the numerical value it represents.
Drawing a bar graph
Step 1: Take a graph paper and draw a horizontal line OX and a vertical line OY. These lines are called the
X-axis and the Y-axis respectively.
Step 2: Mark points at equal intervals along the X-axis. Below these points write the names of the data items
whose values are to be plotted.
Step 3: Choose a suitable scale on Y-axis. On that scale find the heights of the bars for the given numerical
values.
Step 4: Mark off these heights parallel to the Y-axis from the points taken in step 2.
Step 5: On the X-axis, draw bars of equal width for the heights marked in step 4. The bars should be centered
on the points marked on the X-axis. These bars represent the given numerical data.
245