
Page 260 - ICSE Math 8
P. 260
2. The following table gives the number of students in class VIII in a school during academic years
1999–2000 to 2003–2004.
Academic year 1999–2000 2000–2001 2001–2002 2002–2003 2003–2004
Number of students 50 75 125 150 200
Represent the data by a bar graph.
3. Represent the data shown in the table below in the form of a bar graph.
Days Monday Tuesday Wednesday Thursday Friday Saturday Sunday
Number of cold drinks 20 15 20 30 10 12 24
sold (Frequency)
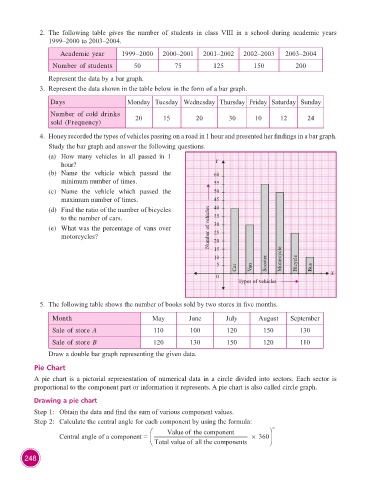
4. Honey recorded the types of vehicles passing on a road in 1 hour and presented her findings in a bar graph.
Study the bar graph and answer the following questions.
(a) How many vehicles in all passed in 1
hour? Y
(b) Name the vehicle which passed the 60
minimum number of times. 55
(c) Name the vehicle which passed the 50
maximum number of times. 45
(d) Find the ratio of the number of bicycles 40
to the number of cars. 35
(e) What was the percentage of vans over Number of vehicles 30
25
motorcycles? 20
15
10 Motorcycle
5 Scooter Bicycle
Car Van Bus
0 X
Types of vehicles
5. The following table shows the number of books sold by two stores in five months.
Month May June July August September
Sale of store A 110 100 120 150 130
Sale of store B 120 130 150 120 110
Draw a double bar graph representing the given data.
Pie Chart
A pie chart is a pictorial representation of numerical data in a circle divided into sectors. Each sector is
proportional to the component part or information it represents. A pie chart is also called circle graph.
Drawing a pie chart
Step 1: Obtain the data and find the sum of various component values.
Step 2: Calculate the central angle for each component by using the formula:
Ê Valueofthe component ˆ
Central angle of a component = Á Totalvalue of allthe components 360¥ ˜
¯ ¯
Ë
248