Page 263 - ICSE Math 8
P. 263

3.  In the month of October 2009, a house holder spent his monthly salary amounting to ` 7,200 on different
                        items as given below.


                            Items                    Clothing       Food       House rent   Education    Miscellaneous


                            Amount spent (in `)         600         4,000        1,200         400           1,000

                         Represent the information in the form of a pie chart.

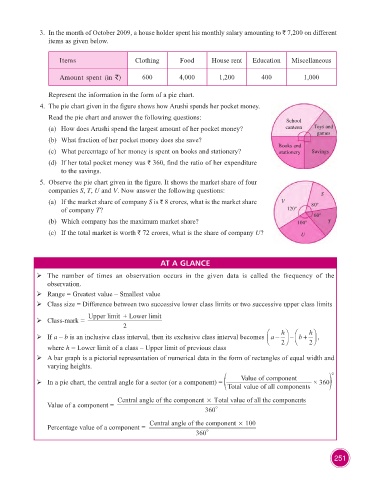
                      4.  The pie chart given in the figure shows how Arushi spends her pocket money.
                         Read the pie chart and answer the following questions:                         School
                         (a)  How does Arushi spend the largest amount of her pocket money?            canteen   Toys and
                                                                                                                  games
                         (b)  What fraction of her pocket money does she save?
                                                                                                     Books and
                         (c)  What percentage of her money is spent on books and stationery?         stationery  Savings
                         (d)   If her total pocket money was ` 360, find the ratio of her expenditure
                             to the savings.
                      5.  Observe the pie chart given in the figure. It shows the market share of four
                        companies S, T, U and V. Now answer the following questions:
                                                                                                                   S
                         (a)    If the market share of company S is ` 8 crores, what is the market share   V    80º
                             of company T?                                                              120º
                                                                                                                 60º
                         (b)  Which company has the maximum market share?                                  100º      T
                         (c)  If the total market is worth ` 72 crores, what is the share of company U?      U


                                                              AT A GLANCE

                    ¾   The  number  of  times  an  observation  occurs  in  the  given  data  is  called  the  frequency  of  the
                        observation.

                    ¾   Range = Greatest value – Smallest value
                    ¾   Class size = Difference between two successive lower class limits or two successive upper class limits
                                      Upperlimit +Lower limit
                    ¾   Class-mark =
                                                 2
                                                                                                 Ê    hˆ   Ê   hˆ
                    ¾   If a – b is an inclusive class interval, then its exclusive class interval becomes  a -  ˜  -  Á Ë b +  ˜ ¯ 2  ,
                                                                                                 Á
                                                                                                 Ë
                                                                                                       ¯ 2
                        where h = Lower limit of a class – Upper limit of previous class
                    ¾   A bar graph is a pictorial representation of numerical data in the form of rectangles of equal width and
                        varying heights.
                                                                                         Value of component            °
                    ¾   In a pie chart, the central angle for a sector (or a component) =                        × 360
                                                                                    Total value of all components

                                               Central angle of the component   Total value of all the co×  m mponents
                        Value of a component =                                  
                                                                             360
                                                          Central angle of the component   100×
                        Percentage value of a component =                    
                                                                         360


                                                                                                                        251
   258   259   260   261   262   263   264   265   266   267   268