
Page 266 - ICSE Math 8
P. 266
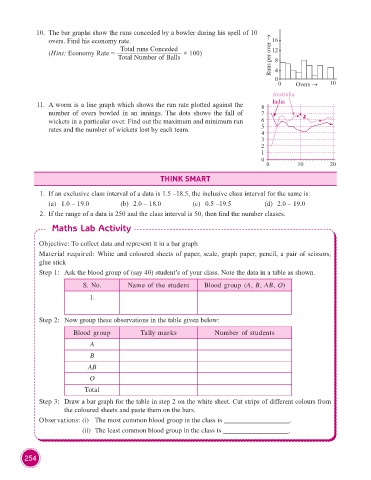
10.  The bar graphs show the runs conceded by a bowler during his spell of 10
                        overs. Find his economy rate.                                              16
                                                Total runs Conceded                                12
                         (Hint: Economy Rate =                        × 100)
                                                Total Number of Balls                             Runs per over →  8
                                                                                                    4
                                                                                                    0
                                                                                                     0     Overs →    10
                                                                                                   Australia
                     11.  A worm is a line graph which shows the run rate plotted against the   8  India
                        number  of overs bowled in an  innings.  The  dots shows the  fall  of   7
                        wickets in a particular over. Find out the maximum and minimum run     6
                        rates and the number of wickets lost by each team.                     5
                                                                                               4
                                                                                               3
                                                                                               2
                                                                                               1
                                                                                               0
                                                                                                 0         10         20
                                                              THINK SMART


                      1.  If an exclusive class interval of a data is 1.5 –18.5, the inclusive class interval for the same is:
                         (a)  1.0 – 19.0        (b)  2.0 – 18.0         (c)  0.5 –19.5          (d)  2.0 – 19.0
                      2.  If the range of a data is 250 and the class interval is 50, then find the number classes.

                          Maths Lab Activity

                     Objective: To collect data and represent it in a bar graph
                     Material required: White and coloured sheets of paper, scale, graph paper, pencil, a pair of scissors,
                     glue stick
                     Step 1:  Ask the blood group of (say 40) student’s of your class. Note the data in a table as shown.

                                    S. No.         Name of the student      Blood group (A, B, AB, O)
                                      1.


                     Step 2:  Now group these observations in the table given below:

                                 Blood group           Tally marks              Number of students
                                      A
                                      B

                                      AB
                                      O
                                    Total

                     Step 3:  Draw a bar graph for the table in step 2 on the white sheet. Cut strips of different colours from
                              the coloured sheets and paste them on the bars.
                     Observations: (i)  The most common blood group in the class is ___________________.
                                    (ii)  The least common blood group in the class is ___________________.


                254