
Page 261 - ICSE Math 8
P. 261
Step 3: Draw a circle of any radius.
Step 4: Draw a horizontal line as the radius of the circle.
Step 5: Starting with this horizontal radius and moving in clockwise direction, draw sectors using the central
angles calculated in step 2 one at a time till all the components are exhausted.
Step 6: Shade the sectors using different colours/designs and name them.
Reading a pie chart
The process of obtaining various information related to the given data from a given pie chart is known as
reading pie chart.
For reading a pie chart, we need to know the following results:
Central angle of the component Total value of all the co× m mponents
(i) Value of a component =
360
Central angle of the component 100×
(ii) Percentage value of a component =
360
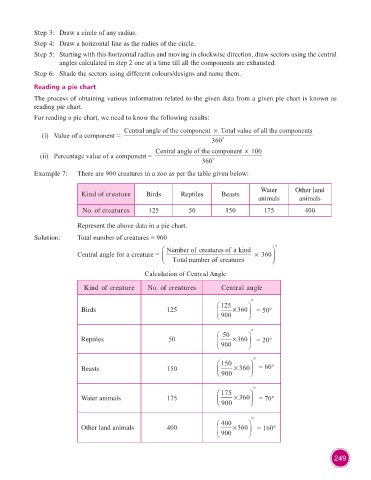
Example 7: There are 900 creatures in a zoo as per the table given below:
Water Other land
Kind of creature Birds Reptiles Beasts
animals animals
No. of creatures 125 50 150 175 400
Represent the above data in a pie chart.
Solution: Total number of creatures = 900
Ê Number of creatures ofa kind ˆ
Central angle for a creature = Á Total numberofcreatures ¥ 360 ˜ ¯
Ë
Calculation of Central Angle
Kind of creature No. of creatures Central angle
125 °
Birds 125 × 360 = 50°
900
50 °
Reptiles 50 × 360 = 20°
900
Ê 150 ˆ ∞
Beasts 150 Á Ë 900 ¥ 360 ˜ = 60°
¯
Ê 175 ˆ ∞
Water animals 175 Á Ë 900 ¥ 360 ˜ = 70°
¯
400 °
Other land animals 400 × 360 = 160°
900
249