Page 259 - ICSE Math 8
P. 259

Solution:     (a)  The given bar graph represents the number  of  students wearing shoes of different
                                      numbers out of a total of (500 + 300 + 400 + 800 + 500 + 100 + 400) 3,000 selected
                                      students.
                                  (b)  Students wear shoes of numbers 4, 5, 6, 7, 8, 9 and 10.
                                  (c)  Shoe number 7 is worn by maximum number of students. There are 800 students wearing it.
                                  (d)  Shoe number 9 is worn by minimum number of students. There are 100 students wearing it.

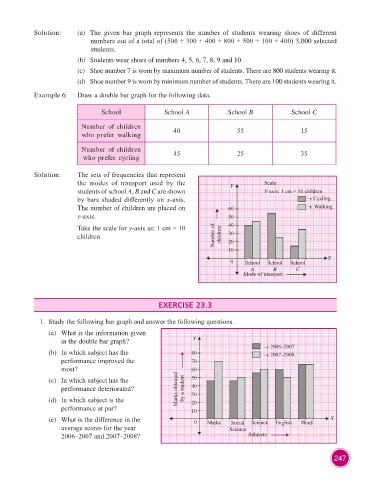
                    Example 6:    Draw a double bar graph for the following data.


                                          School               School A             School B             School C

                                   Number of children             40                   55                   15
                                   who prefer walking
                                   Number of children             45                   25                   35
                                    who prefer cycling


                    Solution:     The sets of frequencies that represent
                                  the  modes  of  transport  used  by  the           Y          Scale:
                                  students of school A, B and C are shown                       Y-axis: 1 cm = 10 children
                                  by  bars  shaded  differently  on  x-axis.                                  → Cycling
                                  The number of children are placed on              60                        → Walking
                                  y-axis.                                           50

                                    Take the scale for y-axis as: 1 cm = 10         40
                                  children                                      Number of    children  30
                                                                                    20
                                                                                    10
                                                                                                                     X
                                                                                     0    School   School   School
                                                                                            A      B       C
                                                                                         Mode of transport


                                                             EXERCISE 23.3

                      1.  Study the following bar graph and answer the following questions.

                         (a)    What is the information given
                             in the double bar graph?                   Y
                                                                                                → 2006–2007
                         (b)    In which subject has the                80                      → 2007–2008
                             performance improved the                   70
                             most?                                      60

                         (c)    In which subject has the                50
                             performance deteriorated?             Marks obtained    by a student  40
                                                                        30
                         (d)    In which subject is the                 20
                             performance at par?                        10

                         (e)    What is the difference in the            0   Maths   Social   Science  English  Hindi  X
                             average scores for the year                             Science
                             2006–2007 and 2007–2008?                                      Subjects


                                                                                                                        247
   254   255   256   257   258   259   260   261   262   263   264