Page 223 - ICSE Math 5
P. 223

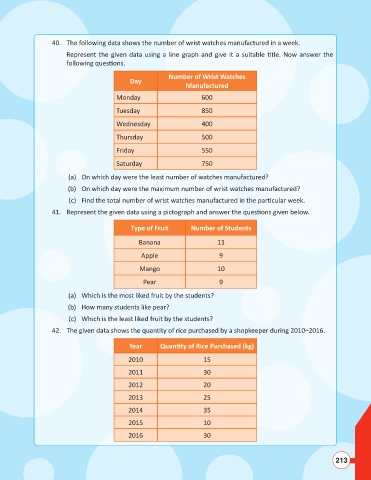
40.  The following data shows the number of wrist watches manufactured in a week.
                               Represent the given data using a line graph and give it a suitable   tle. Now answer the
                              following ques  ons.

                                                                Number of Wrist Watches
                                                    Day
                                                                      Manufactured
                                               Monday                      600

                                               Tuesday                     850

                                               Wednesday                   400
                                               Thursday                    500

                                               Friday                      550

                                               Saturday                    750

                               (a)  On which day were the least number of watches manufactured?
                               (b)  On which day were the maximum number of wrist watches manufactured?

                               (c)  Find the total number of wrist watches manufactured in the par  cular week.
                          41.  Represent the given data using a pictograph and answer the ques  ons given below.

                                                    Type of Fruit       Number of Students

                                                      Banana                     11

                                                       Apple                     9

                                                       Mango                     10
                                                        Pear                     9

                               (a)  Which is the most liked fruit by the students?

                               (b)  How many students like pear?
                               (c)  Which is the least liked fruit by the students?
                          42.  The given data shows the quan  ty of rice purchased by a shopkeeper during 2010–2016.


                                                   Year       Quan  ty of Rice Purchased (kg)

                                                   2010                     15
                                                   2011                     30

                                                   2012                     20
                                                   2013                     25

                                                   2014                     35

                                                   2015                     10
                                                   2016                     30


                                                                                                                        213
   218   219   220   221   222   223   224   225   226   227   228