Page 219 - ICSE Math 5
P. 219

38.  Express the following as directed.
                               (a)  70 L as a percentage of 280 L           (b)  9.75 kg as a percentage of 65 kg

                               (c)  36 cm as a percentage of 900 m
                          39.  Find the value of the following.
                                                                                                 1
                               (a)  17% of 4,500 cm           (b)  25% of 6,750 L           (c)   % of 624 km
                                                                                                 8
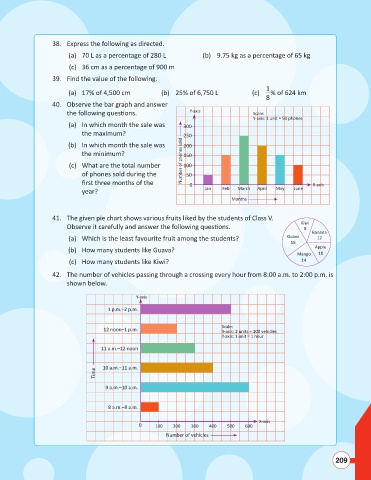
                          40.  Observe the bar graph and answer
                               the following ques  ons.                Y-axis                Scale:
                                                                                             Y-axis: 1 unit = 50 phones
                               (a)   In which month the sale was     300
                                    the maximum?                     250
                               (b)   In which month the sale was     200
                                    the minimum?                     150
                               (c)   What are the total number       Number of phones sold  100
                                    of phones sold during the         50
                                    fi rst three months of the          0                                        X-axis
                                    year?                                   Jan   Feb  March  April  May  June
                                                                                     Months


                          41.  The given pie chart shows various fruits liked by the students of Class V.
                                                                                                            Kiwi
                               Observe it carefully and answer the following ques  ons.                       8
                                                                                                                Banana
                               (a)  Which is the least favourite fruit among the students?              Guava     12
                                                                                                         16
                               (b)  How many students like Guava?                                                Apple
                                                                                                           Mango  10
                               (c)  How many students like Kiwi?                                             14

                          42.  The number of vehicles passing through a crossing every hour from 8:00 a.m. to 2:00 p.m. is
                               shown below.

                                                      Y-axis
                                            1 p.m.–2 p.m.


                                                                                  Scale:
                                           12 noon–1 p.m.                         X-axis: 2 units = 100 vehicles
                                                                                  Y-axis: 1 unit = 1 hour
                                          11 a.m.–12 noon


                                          10 a.m.–11 a.m.
                                        Time

                                           9 a.m.–10 a.m.


                                            8 a.m.–9 a.m.

                                                                                               X-axis
                                                      0     100   200   300   400   500   600
                                                                Number of vehicles


                                                                                                                        209
   214   215   216   217   218   219   220   221   222   223   224