Page 224 - ICSE Math 5
P. 224

Represent the given data using a bar graph. Then answer the following ques  ons.
                               (a)  In which year was the maximum rice purchased?

                               (b)  In which year was the minimum rice purchased?
                               (c)  How much more rice was purchased in the year 2013 than that in the year 2010?
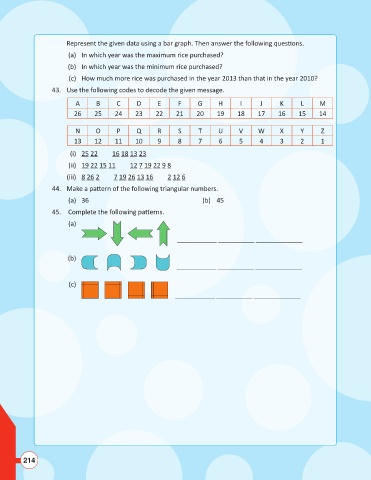
                          43.  Use the following codes to decode the given message.

                                 A      B      C      D      E      F     G      H      I      J      K     L      M

                                 26     25     24    23     22     21     20     19    18     17     16     15     14

                                 N      O      P      Q      R      S     T      U      V     W       X     Y      Z
                                 13     12     11    10      9      8     7      6      5      4      3     2      1

                                (i) 25 22     16 18 13 23
                               (ii) 19 22 15 11  127192298

                              (iii) 8 26 2  719261316  2126
                          44.  Make a pa  ern of the following triangular numbers.

                               (a) 36                                       (b)  45
                          45.   Complete the following pa  erns.
                               (a)


                                                                   ___________ __________ _____________


                               (b)
                                                                   ___________ __________ _____________


                               (c)
                                                                   ___________ __________ _____________


                214
   219   220   221   222   223   224   225   226   227   228   229