Page 198 - Start Up Mathematics_5
P. 198

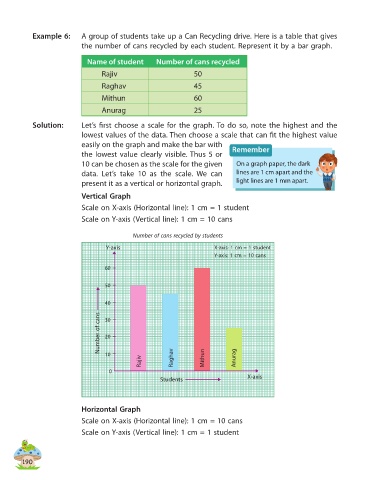
Example 6:      A group of students take up a Can Recycling drive. Here is a table that gives
                            the number of cans recycled by each student. Represent it by a bar graph.


                              Name of student        Number of cans recycled
                                   Rajiv                         50

                                   Raghav                        45
                                   Mithun                        60

                                   Anurag                        25

            Solution:       Let’s first choose a scale for the graph. To do so, note the highest and the
                            lowest values of the data. Then choose a scale that can fit the highest value
                            easily on the graph and make the bar with         Remember
                            the lowest value clearly visible. Thus 5 or
                            10 can be chosen as the scale for the given        On a graph paper, the dark
                            data. Let’s take 10 as the scale.  We can          lines are 1 cm apart and the
                            present it as a vertical or horizontal graph.      light lines are 1 mm apart.
                            Vertical Graph

                            Scale on X-axis (Horizontal line): 1 cm = 1 student
                            Scale on Y-axis (Vertical line): 1 cm = 10 cans


                                             Number of cans recycled by students
                                    Y-axis                              X-axis: 1 cm = 1 student
                                                                        Y-axis: 1 cm = 10 cans
                                    60


                                    50


                                    40
                                  Number of cans  30


                                    20

                                    10
                                                Rajiv     Raghav     Mithun    Anurag

                                     0
                                                      Students                     X-axis


                            Horizontal Graph

                            Scale on X-axis (Horizontal line): 1 cm = 10 cans
                            Scale on Y-axis (Vertical line): 1 cm = 1 student


         190
   193   194   195   196   197   198   199   200   201   202   203