
Page 193 - Start Up Mathematics_5
P. 193
15
Data Handling
Let's Recall …
Pictograph is the method of representing data by using pictures. Another
method of representing data is by using a bar graph.
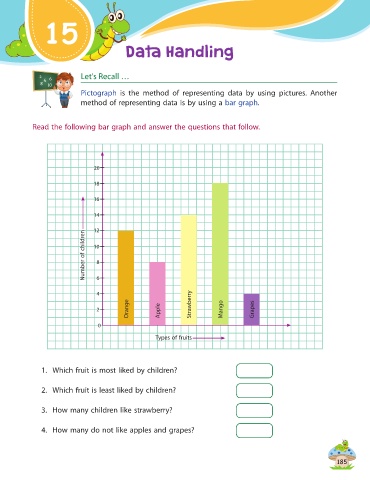
Read the following bar graph and answer the questions that follow.
20
18
16
14
12
Number of children 10
8
6
4
Orange Apple Mango Grapes
2 Strawberry
0
Types of fruits
1. Which fruit is most liked by children?
2. Which fruit is least liked by children?
3. How many children like strawberry?
4. How many do not like apples and grapes?
185