Page 195 - Start Up Mathematics_5
P. 195

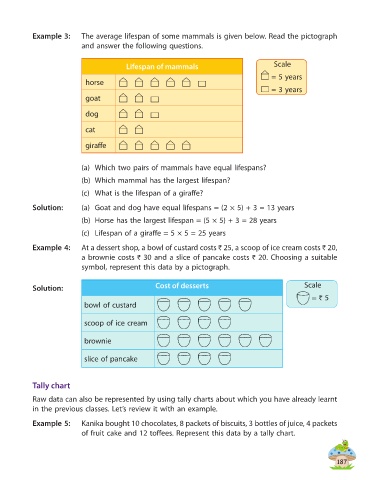
Example 3:      The average lifespan of some mammals is given below. Read the pictograph
                            and answer the following questions.


                                           Lifespan of mammals                              Scale
                                                                                           = 5 years
                             horse
                                                                                           = 3 years
                             goat

                             dog


                             cat

                             giraffe


                            (a)  Which two pairs of mammals have equal lifespans?
                            (b)  Which mammal has the largest lifespan?

                            (c)  What is the lifespan of a giraffe?

            Solution:       (a)  Goat and dog have equal lifespans = (2 × 5) + 3 = 13 years
                            (b)  Horse has the largest lifespan = (5 × 5) + 3 = 28 years

                            (c)  Lifespan of a giraffe = 5 × 5 = 25 years

            Example 4:      At a dessert shop, a bowl of custard costs ` 25, a scoop of ice cream costs ` 20,
                            a brownie costs  ` 30 and a slice of pancake costs  ` 20. Choosing a suitable
                            symbol, represent this data by a pictograph.


            Solution:                               Cost of desserts                                  Scale
                                                                                                        = ` 5
                             bowl of custard


                             scoop of ice cream

                             brownie


                             slice of pancake


            Tally chart

            Raw data can also be represented by using tally charts about which you have already learnt
            in the previous classes. Let’s review it with an example.

            Example 5:      Kanika bought 10 chocolates, 8 packets of biscuits, 3 bottles of juice, 4 packets
                            of fruit cake and 12 toffees. Represent this data by a tally chart.


                                                                                                                 187
   190   191   192   193   194   195   196   197   198   199   200