
Page 197 - Start Up Mathematics_5
P. 197
3. Four friends had a motorbike race and covered the given distances. Rohit biked
15 km, Aditya biked 10 km, Salman biked 25 km and Manav biked 20 km. Represent
the given data in tabular format and also by a pictograph.
4. Five children were given a story book each. The number of pages they had read at
the end of the day are given below.
Arushi read 50 pages, Devesh read 45 pages, Honey read 55 pages, Kinjal read 40 pages
and Vini read 35 pages. Represent this in a tabular format and also by a pictograph.
5. The cost of apples in different cities is as follows:
Delhi—` 100/kg, Mumbai—` 120/kg, Chennai—` 90/kg, Bengaluru—` 110/kg. Represent
this data in a tabular format and also by a pictograph. In which city are apples the
costliest and in which the cheapest?
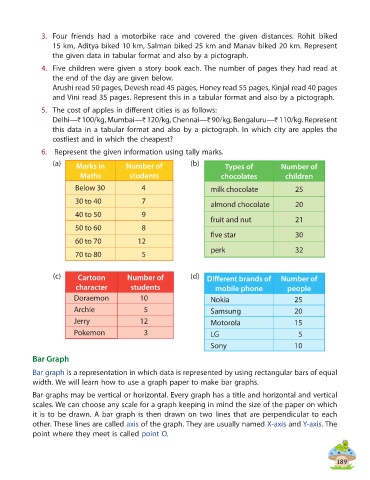
6. Represent the given information using tally marks.
(a) Marks in Number of (b) Types of Number of
Maths students chocolates children
Below 30 4 milk chocolate 25
30 to 40 7 almond chocolate 20
40 to 50 9
fruit and nut 21
50 to 60 8
five star 30
60 to 70 12
perk 32
70 to 80 5
(c) Cartoon Number of (d) Different brands of Number of
character students mobile phone people
Doraemon 10 Nokia 25
Archie 5 Samsung 20
Jerry 12 Motorola 15
Pokemon 3 LG 5
Sony 10
Bar Graph
Bar graph is a representation in which data is represented by using rectangular bars of equal
width. We will learn how to use a graph paper to make bar graphs.
Bar graphs may be vertical or horizontal. Every graph has a title and horizontal and vertical
scales. We can choose any scale for a graph keeping in mind the size of the paper on which
it is to be drawn. A bar graph is then drawn on two lines that are perpendicular to each
other. These lines are called axis of the graph. They are usually named X-axis and Y-axis. The
point where they meet is called point O.
189