
Page 202 - Start Up Mathematics_5
P. 202
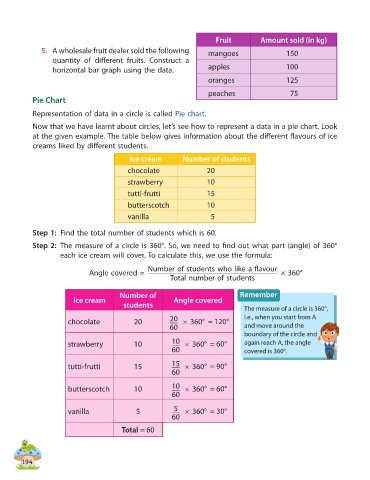
Fruit          Amount sold (in kg)
              5.  A wholesale fruit dealer sold the following         mangoes                   150
                  quantity of different fruits.  Construct  a
                  horizontal bar graph using the data.                apples                    100

                                                                      oranges                   125
                                                                      peaches                    75
            Pie Chart
            Representation of data in a circle is called Pie chart.

            Now that we have learnt about circles, let’s see how to represent a data in a pie chart. Look
            at the given example. The table below gives information about the different flavours of ice
            creams liked by different students.

                                            Ice cream        Number of students
                                           chocolate                 20
                                           strawberry                10

                                           tutti-frutti              15
                                           butterscotch              10

                                           vanilla                     5

            Step 1:  Find the total number of students which is 60.

            Step 2:   The measure of a circle is 360°. So, we need to find out what part (angle) of 360°
                     each ice cream will cover. To calculate this, we use the formula:
                                                  Number of students who like a flavour
                               Angle covered =                                                × 360°
                                                         Total number of students


                                         Number of                              Remember
                         Ice cream                        Angle covered
                                          students                                The measure of a circle is 360°,

                       chocolate             20          20   × 360° = 120°       i.e., when you start from A

                                                         60                       and move around the
                                                                                  boundary of the circle and
                       strawberry            10           10   × 360°  = 60°      again reach A, the angle
                                                          60                      covered is 360°.


                        tutti-frutti         15           15   × 360° = 90°

                                                          60
                        butterscotch         10           10   × 360° = 60°

                                                          60

                        vanilla               5            5    × 360°  = 30°
                                                          60

                                         Total = 60


         194